 By CryptoPotato | Created at 2026-08-12 17:53:43 | Updated at 2026-08-12 21:55:37
5 hours ago
By CryptoPotato | Created at 2026-08-12 17:53:43 | Updated at 2026-08-12 21:55:37
5 hours ago
Bitcoin remains trapped in a broad consolidation phase, with the price struggling to break above the descending resistance that has governed the market for several months. At around $63.5K, BTC is showing some short-term recovery, but the broader structure remains cautious until the key resistance zones are decisively broken.
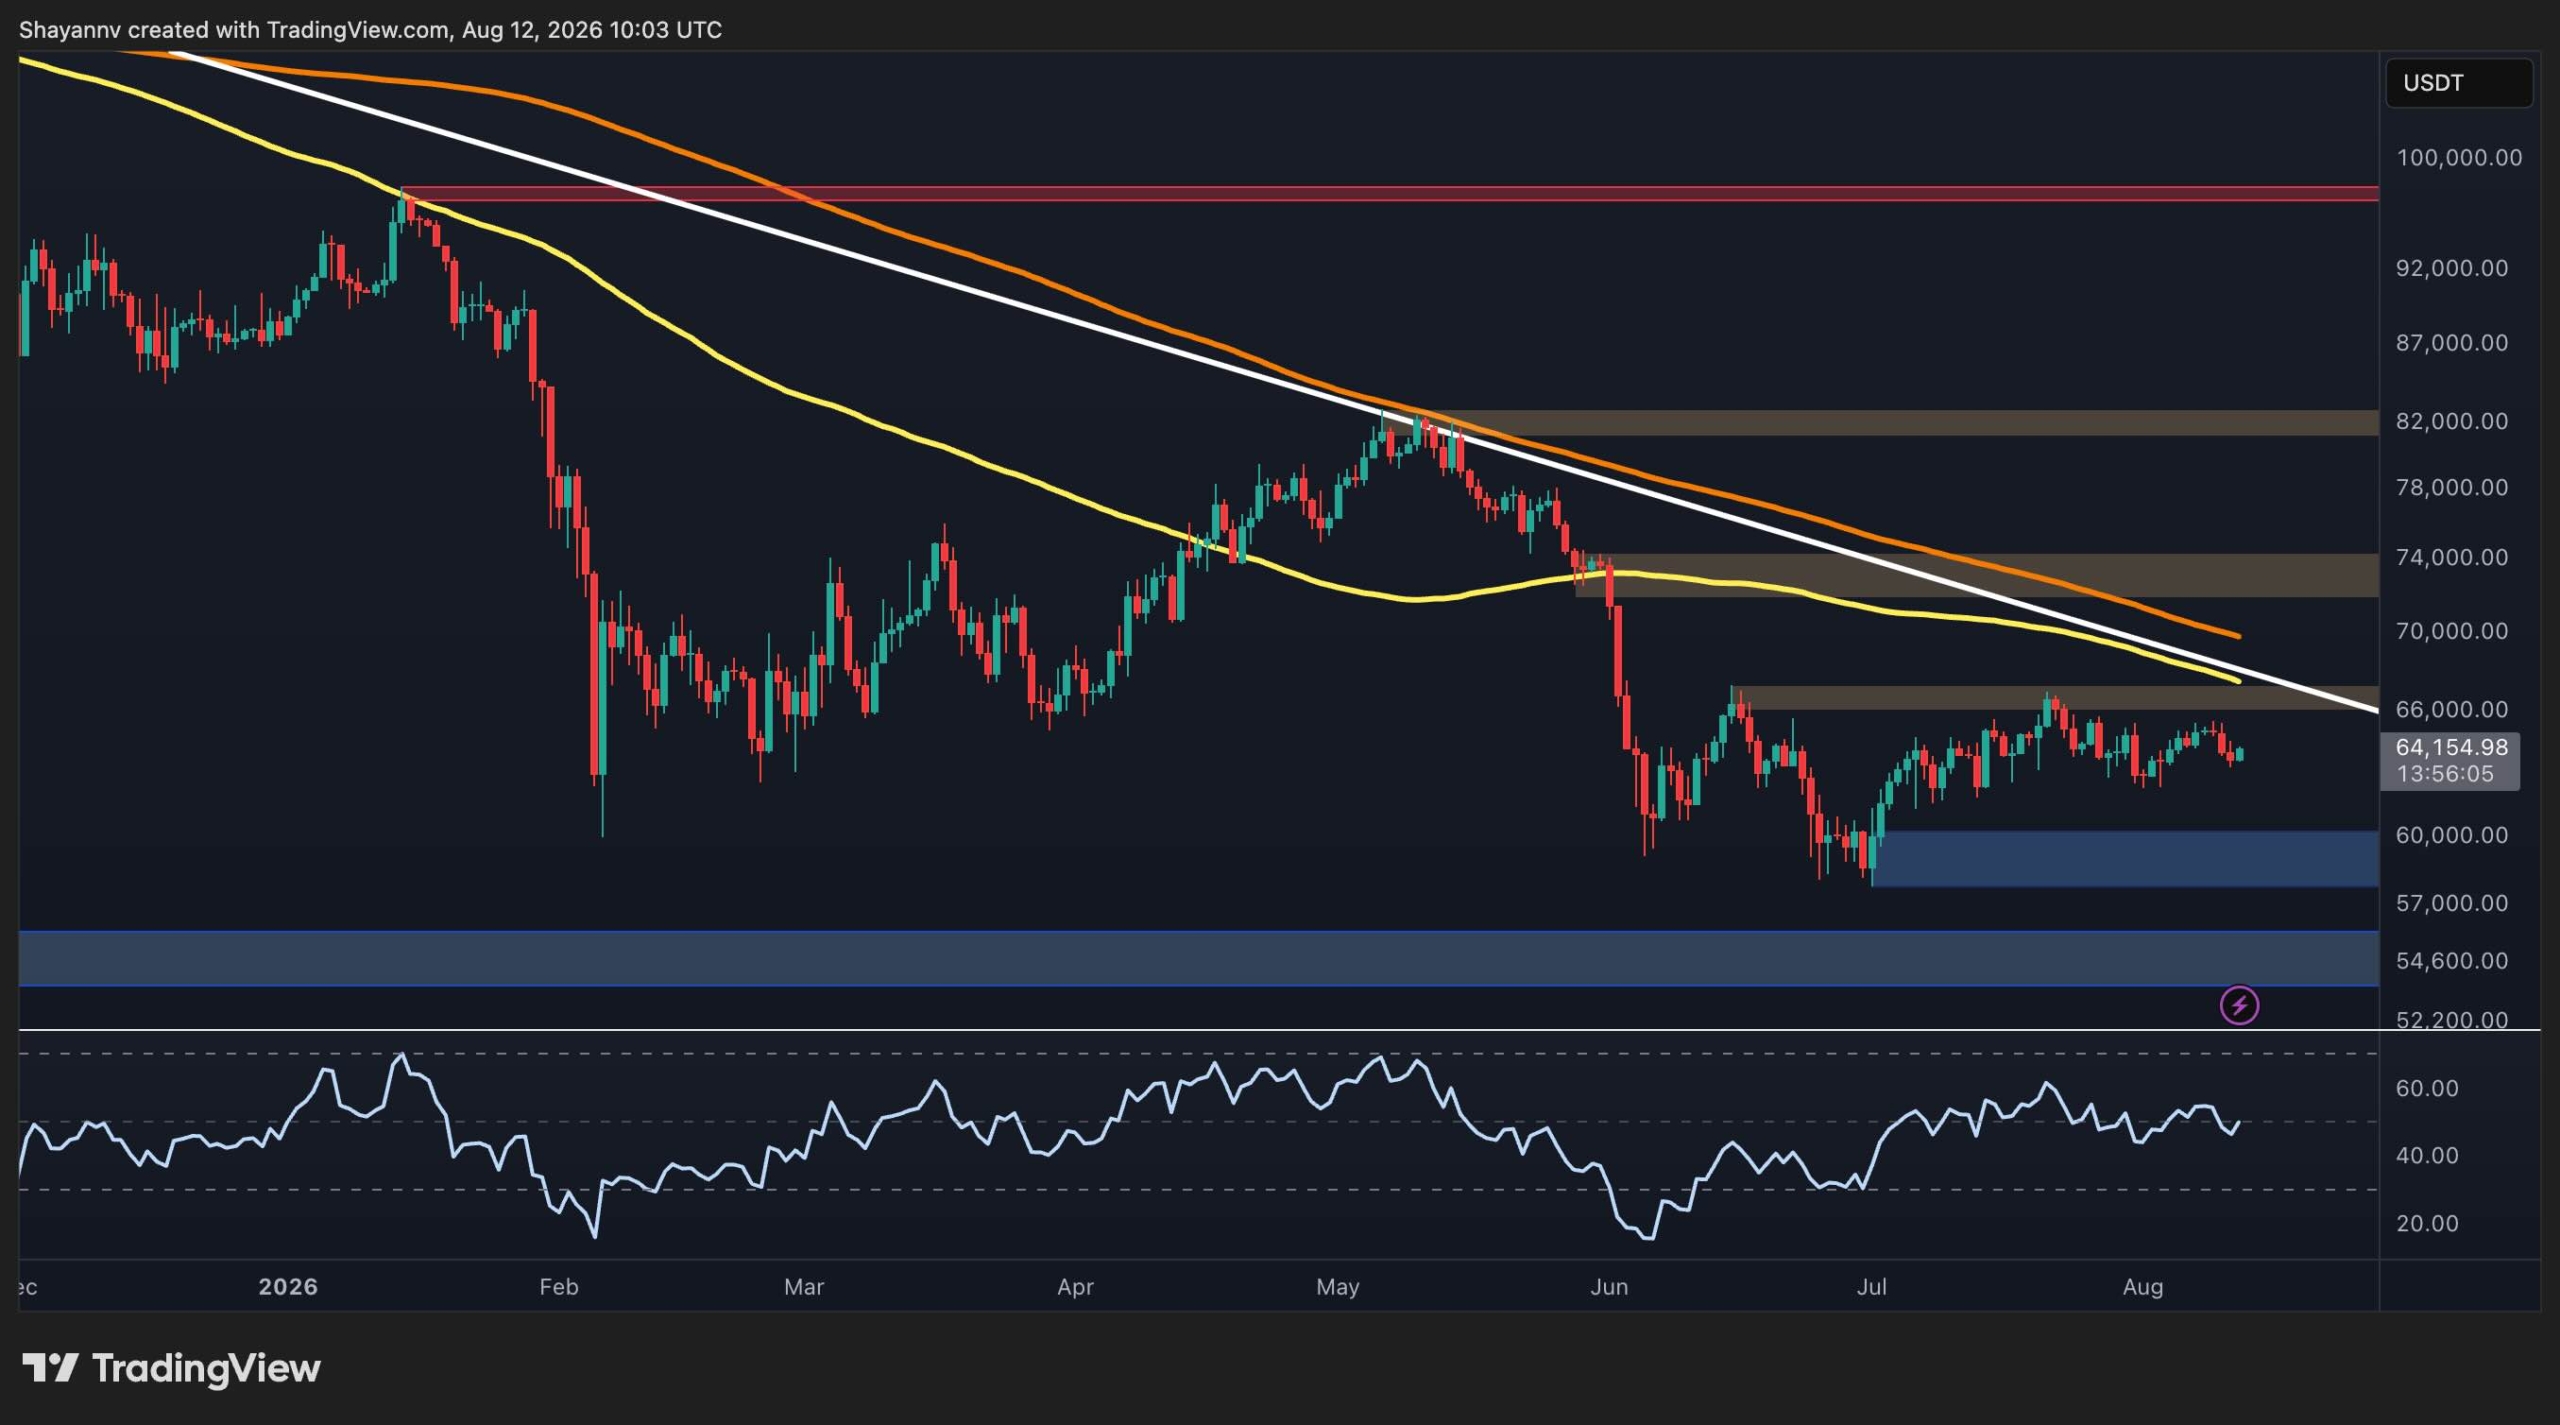
Bitcoin Price Analysis: The Daily Chart
The daily chart shows Bitcoin trading below a descending trendline that connects the major highs since the beginning of the year. The trendline currently sits around the $66K area, making this the first major hurdle for the buyers. A daily breakout above this resistance would represent an important structural improvement and could open the door toward the $74K resistance zone.
The broader trend remains bearish-to-neutral; however, BTC is still trading below the major moving averages displayed on the chart. The longer-term moving averages are sloping downward, reinforcing the significance of the descending trendline.
On the downside, the $60K area represents an important support zone, while the broader $54K region is the next major demand area visible on the chart. Holding above these levels keeps the current consolidation structure intact, whereas a sustained breakdown could signal another leg lower.
BTC/USDT 4-Hour Chart
The 4-hour chart provides a more constructive picture in the short term. Bitcoin has been forming a tightening structure, with an ascending support trendline converging toward a descending resistance trendline. The price is currently around $64K, leaving the market relatively close to the upper boundary.
The key resistance is concentrated around $66K-$67K. A clean breakout above this zone, particularly if accompanied by a sustained move beyond the descending trendline, could trigger a continuation toward the $66K-$67K area and potentially higher.
Conversely, the rising support line and the $62K zone are the most important levels to watch on the downside. A break below this area would weaken the short-term bullish structure and could expose BTC to the $60K support zone again.
The 4-hour RSI has also rebounded from near-oversold conditions and is now recovering toward the middle of its range. This points to improving momentum, although it is not yet strong enough to confirm a sustained upside breakout. For now, the market appears to be waiting for a decisive break from the tightening range.

Sentiment Analysis
The funding-rate chart provides an interesting contrast to Bitcoin’s price action. Funding rates were deeply negative during the sharp sell-off earlier in the year, with several significant spikes below zero as BTC traded around the $70K-$80K region. This indicated that bearish positioning had become particularly aggressive.
Since then, funding has gradually normalized and has turned predominantly positive. The latest reading is around 0.006%, while Bitcoin is trading near $64K. This suggests that leveraged long positioning has returned, but the funding rate is not yet at an extreme level comparable to the highly crowded periods over the past few years.
That is broadly constructive, although it also introduces some short-term downside risk. If BTC fails to break the $65K-$67K resistance area while funding remains positive, long positions could become vulnerable to a liquidation-driven pullback. Conversely, a breakout accompanied by only moderately positive funding would provide a healthier setup, as it would suggest that the move is not being driven by excessive leverage.
 Screenshot
Disclaimer: Information found on CryptoPotato is those of writers quoted. It does not represent the opinions of CryptoPotato on whether to buy, sell, or hold any investments. You are advised to conduct your own research before making any investment decisions. Use provided information at your own risk. See Disclaimer for more information.