By crypto.news | Created at 2026-08-18 07:45:12 | Updated at 2026-08-18 07:52:26
22 minutes ago
By crypto.news | Created at 2026-08-18 07:45:12 | Updated at 2026-08-18 07:52:26
22 minutes ago
Bitcoin rose above $64,000 on Tuesday, Aug. 18, outperforming several large cryptocurrencies as the broader market recorded mixed price movements.
Summary
- Bitcoin traded at $64,262 on Tuesday, gaining 1.2% over 24 hours and 0.5% weekly overall.
- HYPE rose 1.9% daily and 8.2% weekly, outperforming most large capitalization cryptocurrencies in trading Tuesday.
- Venice Token led top 100 gainers with a 12.5% rise, reaching approximately $13.70 Tuesday afternoon.
- Worldcoin fell 10.8%, while Filecoin and Bitway declined 6.5% and 6.1%, respectively, during Tuesday trading.
- Bitcoin remained inside its $60,000 to $66,000 consolidation range with daily momentum still broadly neutral.
Bitcoin traded near $64,262, up 1.2% over 24 hours and 0.5% over seven days, according to crypto.news market data. Its market capitalization stood near $1.29 trillion, with approximately $21.6 billion in daily trading volume.
The recovery followed a volatile week during which sellers repeatedly defended the $64,400 to $65,400 area. BTC fell as low as approximately $62,500 on Friday and briefly revisited $62,600 on Monday before recovering.
As previously reported, Monday’s rebound carried the market back above $64,000 after buyers defended the area around $62,750.
Bitcoin price remains inside its consolidation range
Bitcoin has traded mainly between $60,000 and $66,000 since the sharp June selloff. Tuesday’s recovery moved the price toward the upper half of that range but did not establish a breakout.
The first resistance area remains between $65,000 and $66,000. Buyers have made several unsuccessful attempts to establish support above $65,000 since the start of August.
Sellers repeatedly defended the area immediately above $65,000 during an earlier recovery. The price would need to clear that zone and remain above it to improve the short term structure.
Support sits around $63,000, followed by the recent lows between $62,000 and $62,600. The wider consolidation floor remains close to $60,000.
Bitcoin’s market dominance remained below 57%, indicating that altcoins still represented more than two fifths of the total cryptocurrency market. However, performance within that group varied widely.
HYPE and VVV lead Tuesday’s crypto gainers
Ether traded near $1,901, up 0.2% over 24 hours and 1.5% over the week. Solana gained 0.7% to approximately $75.95, while Chainlink added 0.3% to $9.43.
Hyperliquid’s HYPE was among the strongest large capitalization assets. It rose 1.9% to $59.90 and gained 8.2% over seven days.
Zcash advanced 3% to approximately $508.94. Morpho gained 3.4% to $2.11, while Sky rose 4.5% to $0.0548.
POL climbed 5.9% to approximately $0.0795, making it one of the strongest liquid assets within the top 100 by market capitalization.
Venice Token led that group with a 12.5% daily gain to $13.70. Venice said its annualized revenue had crossed $100 million. The figure represents a company run rate claim rather than audited annual revenue.
Provenance Blockchain’s HASH gained 8.8%, although its reported 24 hour volume was only about $58,000. The low volume means relatively small transactions could produce larger price movements.
Worldcoin leads losses as altcoins diverge
Worldcoin recorded the largest decline among the top 100 assets, falling 10.8% to approximately $0.324. Filecoin dropped 6.5% to $0.627, while Bitway fell 6.1% to $0.353.
OKB declined 5.5%, followed by Sui and Ether.fi, which each lost 4.1%. Cosmos fell 3.9%, Canton declined 3.8% and Polkadot lost 3.3%.
Among larger assets, Cardano fell 1.9% to approximately $0.173. XRP slipped 0.4% below $1, while BNB declined 0.3% to $603.48. Dogecoin also lost 0.4%, trading just below $0.07.
Weekly performance showed further divergence. Chainlink gained 12.3%, HYPE rose 8.2% and Monero added 6.4%. Uniswap lost 18%, while Filecoin and Pyth Network each fell about 11%.
Stablecoins were excluded from the gainer and loser comparison because their prices are designed to remain close to their reference currencies.
Bitcoin indicators show limited momentum
The BTC/USDT daily chart places Bitcoin near $64,300 and within its established consolidation range. The broader structure remains weaker than the May highs near $80,000.
Aroon Up stood near 71.43%, compared with Aroon Down at 35.71%. This shows that recent highs carried more weight than recent lows, offering limited support for buyers. The indicator has shifted frequently, however, and does not confirm a durable trend.
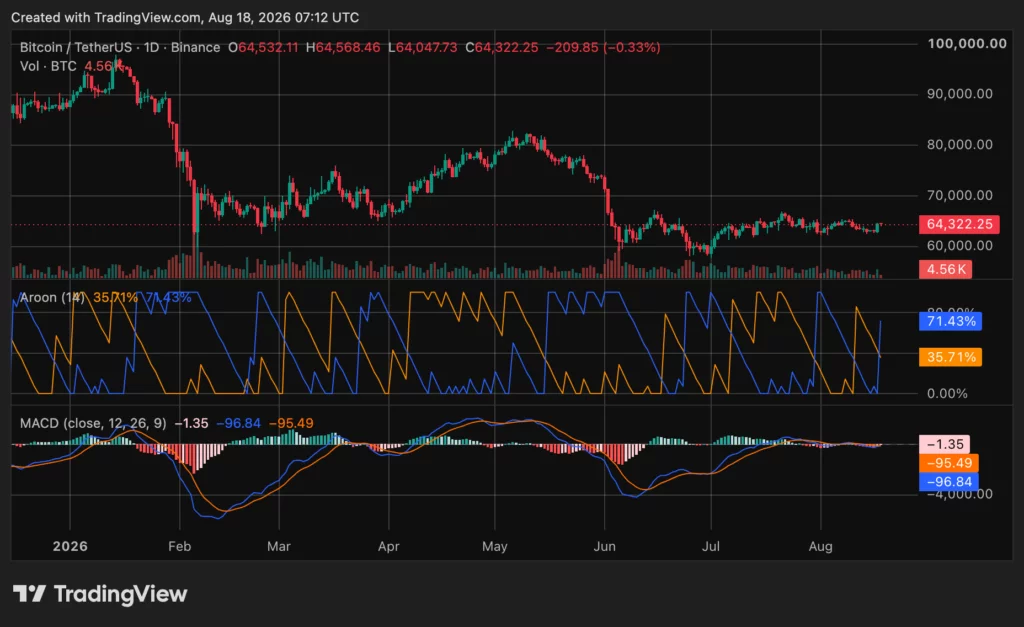 Bitcoin (BTC) price chart, source: crypto.news
The moving average convergence divergence indicator remained close to neutral. The MACD line was near minus 96.84, slightly below its signal line around minus 95.49. The histogram stood near minus 1.35.
Those readings point to weak bearish momentum rather than an accelerating decline. A decisive move outside the current price range would provide clearer evidence of the next direction.
Several market analysts are also watching Bitcoin’s 200 week simple moving average, recently estimated near $63,700. CryptoBullet argued that losing this level resembles the 2022 structure. Rekt Capital said turning it into resistance “would be the confirmation” for deeper downside.
With "limited relief-focused upside" in July having concluded and Bitcoin being in multi-week Lower Highs ever since…
Turning the 200-week SMA into new resistance would be the confirmation to set up additional downside to perform a deeper downside deviation below the… https://t.co/5xTjDjmFIO pic.twitter.com/2Iee7oUxSu
Bitcoin traded briefly below the average during earlier cycles, but past reactions do not guarantee another bottom or a decline toward the 350 week average.
Oil prices add pressure to the wider market
Brent crude rose to approximately $91.76 per barrel on Tuesday as fading hopes for an extended U.S. and Iran ceasefire increased concerns about supply through the Strait of Hormuz, Reuters reported.
Higher energy prices can complicate the outlook for inflation and interest rates. Asian equities and bonds weakened as investors considered the effect of rising oil costs and government borrowing.
Bitcoin nevertheless moved higher during the session, showing short term relative strength against traditional risk markets. One day of outperformance does not establish a lasting separation from equities, bonds or wider liquidity conditions.
The immediate levels to watch are $65,000 to $66,000 on the upside and $62,000 to $63,000 on the downside. A sustained break below the latter area would expose $60,000, while a close above $66,000 would move Bitcoin beyond its recent range.
Disclosure: This article does not represent investment advice. The content and materials featured on this page are for educational purposes only.