By Bitcoin News | Created at 2026-09-13 14:50:31 | Updated at 2026-10-06 19:50:53
3 weeks ago
By Bitcoin News | Created at 2026-09-13 14:50:31 | Updated at 2026-10-06 19:50:53
3 weeks ago
Bitcoin’s price is sitting between $76,400 to $76,700 per unit on Sunday morning, which sounds pretty uneventful until you look under the hood. Short-term momentum has gone sour, BTC has been turned away twice from roughly $82,300-$82,800, and several averages immediately overhead are now working against it. Yet zoom out far enough and almost the opposite picture appears. Bitcoin’s price is still trading above nearly every major longer-term moving average. The bears have the short game. The bulls still own much of the long one.
Key Takeaways
- Bitcoin’s price sits near $76,400 to $76,700 over the last hour after Sept. 12’s wild $79,837-to-$76,040 swing.
- The daily chart’s 11 oscillators lean bearish, but 9 of 15 moving averages remain bullish.
- Bitcoin’s price needs to reach roughly $78,500 per coin, and losing $76,000 would put lower support in play.
1-Hour Chart Outlook
That makes the 1-hour chart a good place to see just how messy things have become. On Sept. 12, bitcoin’s price shot all the way to $79,837 before getting hammered down to $76,040, a $3,797 trip from top to bottom.
Since that shakeout, the fireworks have mostly stopped. BTC has spent its time squeezed between roughly $76,600 and $77,300, with the latest trades around $76,817-$76,819, and Sunday volume looking thin.
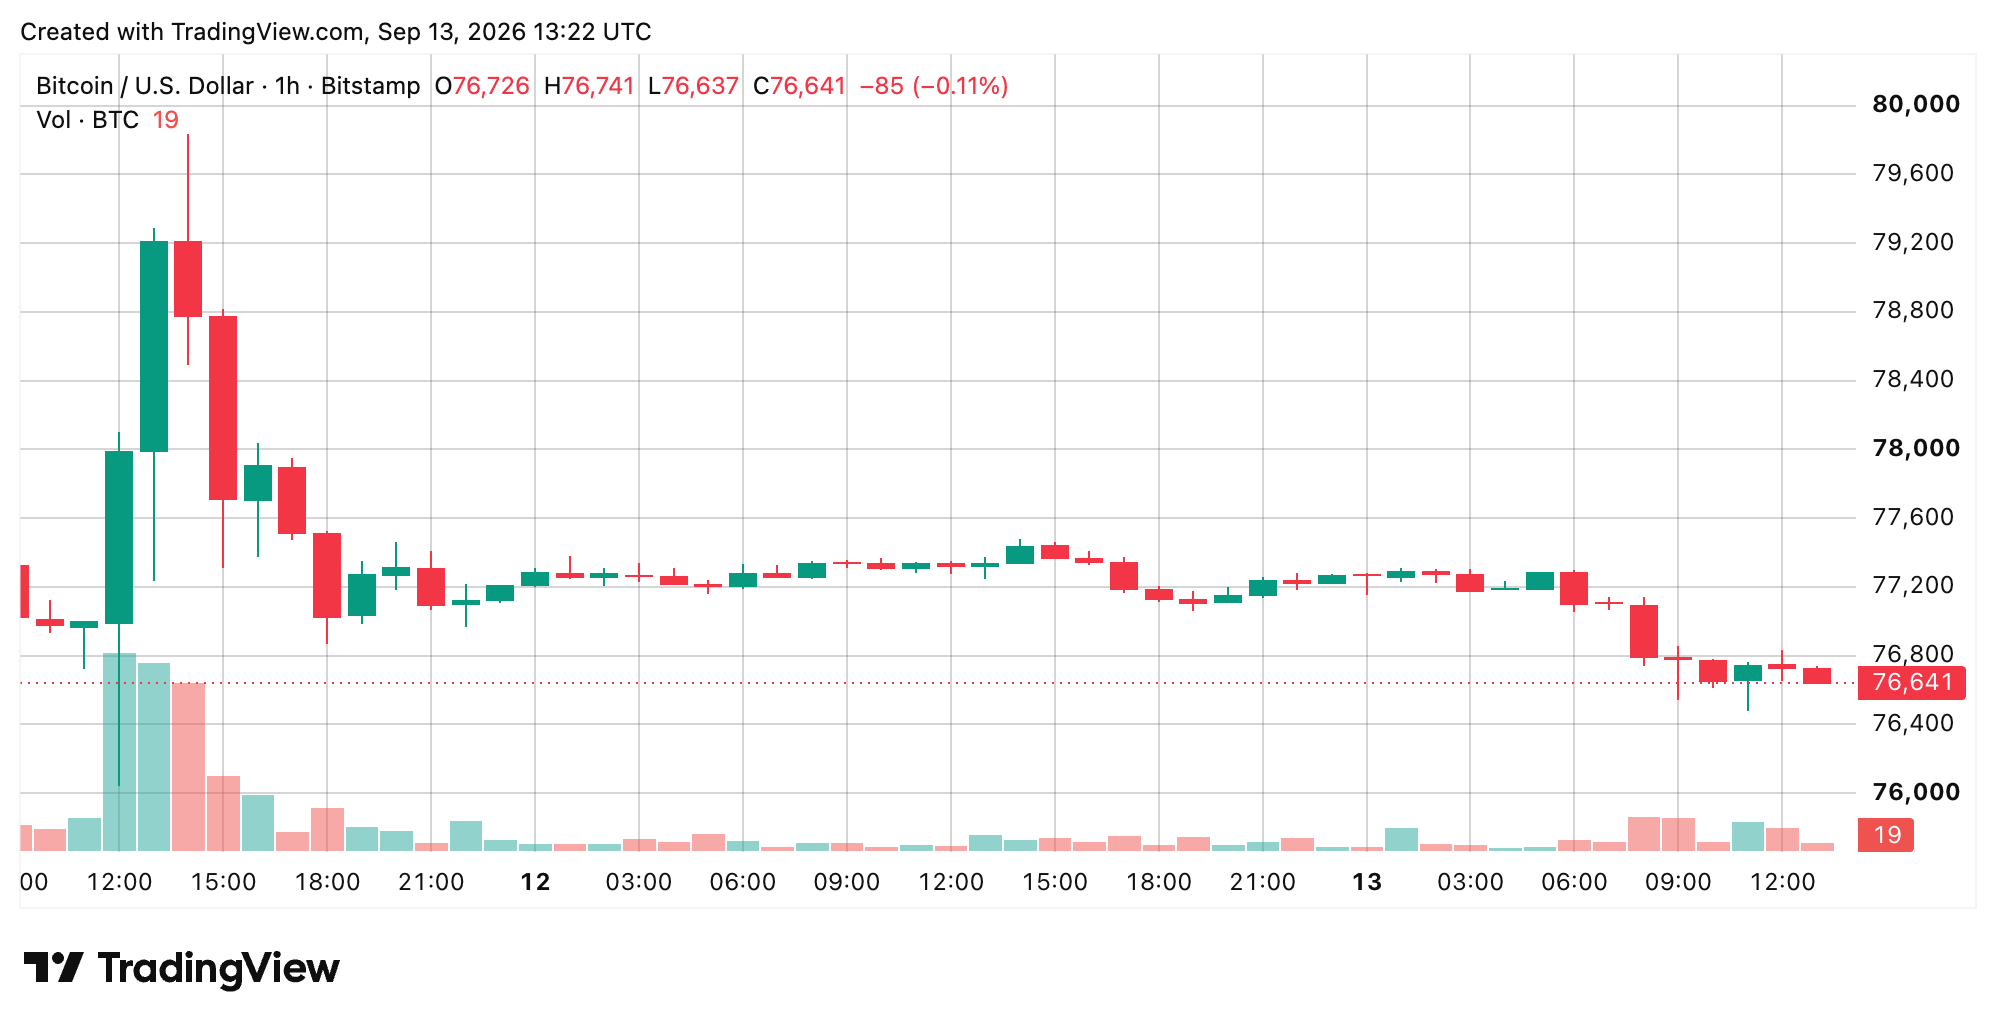 BTC/USD 1-hour chart via Bitstamp on Sept. 13, 2026.
In other words, bitcoin ran a sprint and is now pacing around the locker room. Buyers have been showing up around $76,500-$76,600, while sellers keep leaning on the market around $77,300-$77,500. Escape above $77,500, and that $79,800 neighborhood comes back into view. Fall through $76,040, and suddenly $75,000-$74,000 doesn’t look so far away.
4-Hour Chart Outlook
The 4-hour chart makes that hesitation harder to ignore. Bitcoin’s spot price spent mid-August hanging around $62,470-$65,000 before blasting into the high $70,000s and eventually tagging $82,281. That was the fun part. Since Sept. 4, however, the market has been coughing up lower highs and slowly drifting back toward the mid-$76,000s.
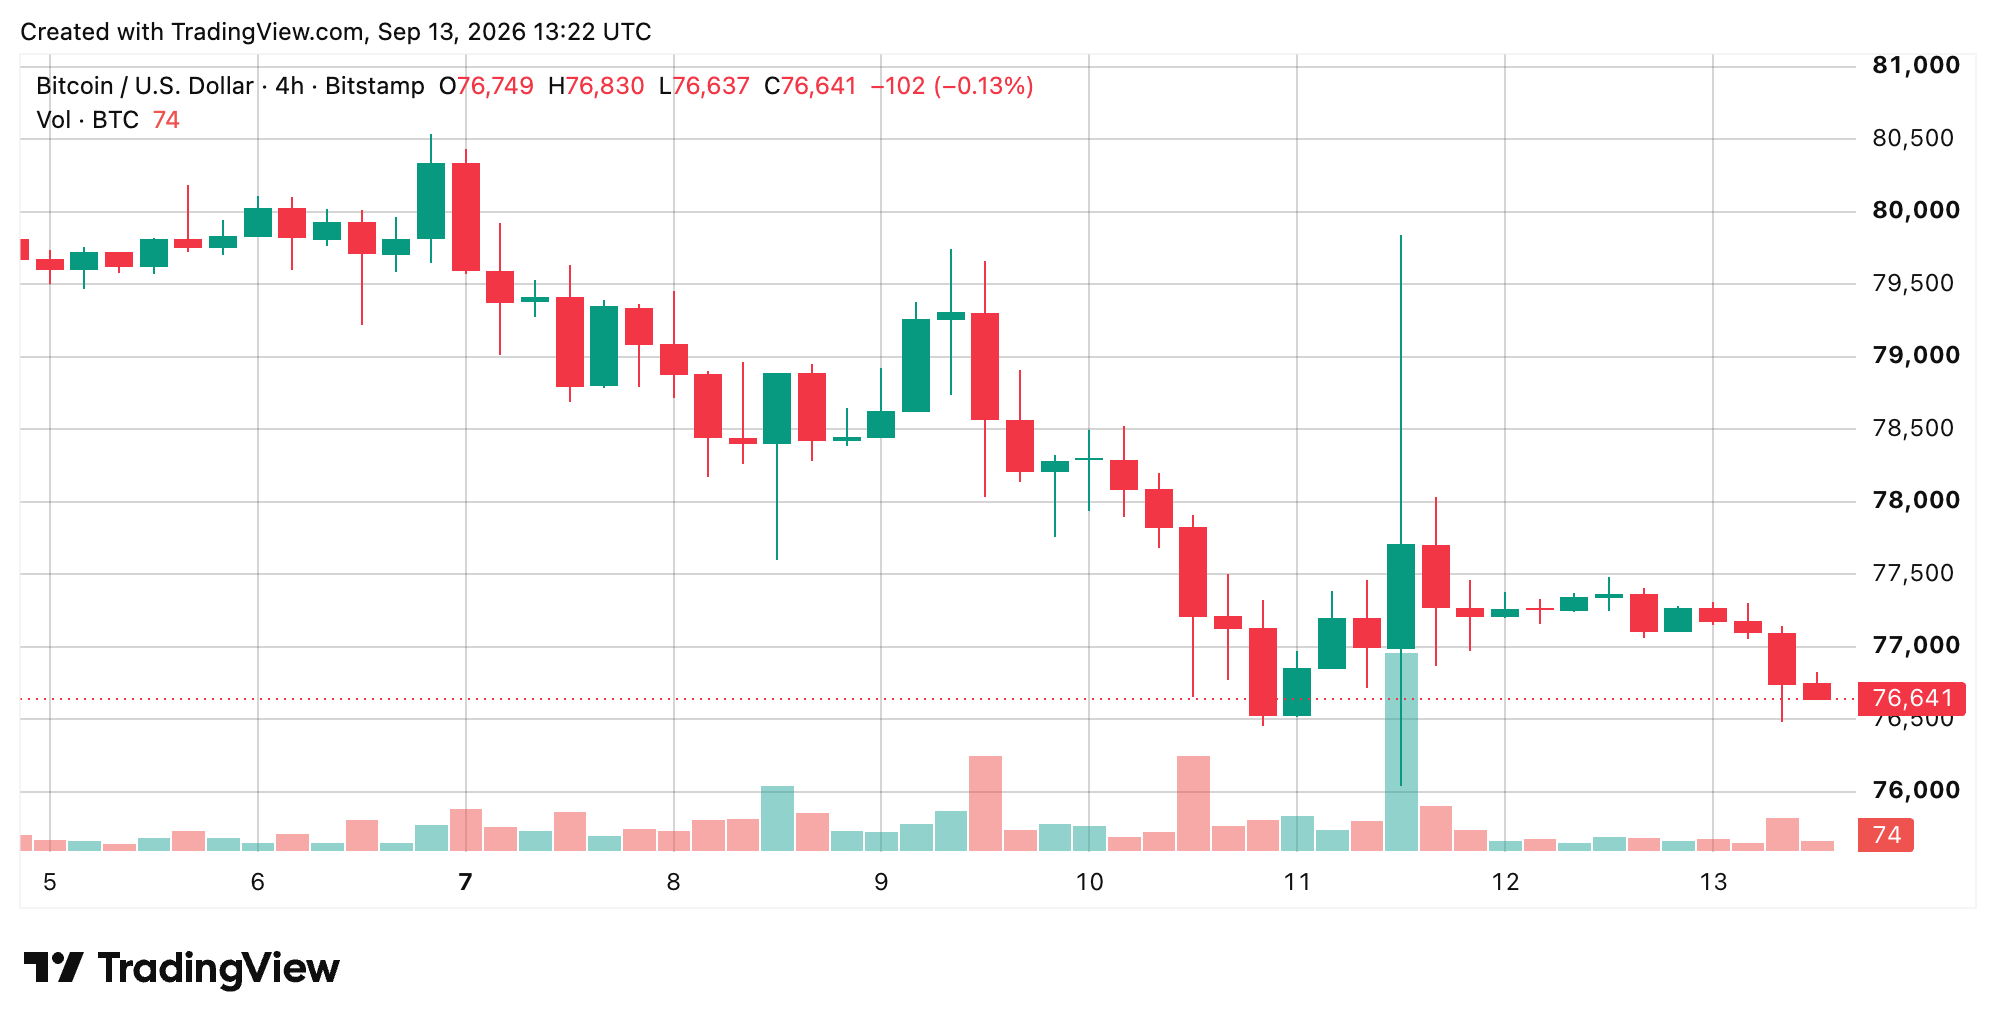 BTC/USD 4-hour chart via Bitstamp on Sept. 13, 2026.
The result is a chart that has gone from explosive to decidedly less impressive. Buyers now have a pretty important patch of ground to defend around $76,400-$76,600. Hold it, and another trip toward $78,000-$78,500 is entirely plausible. Lose it on a 4-hour close, and the tone changes quickly. Above that, $80,000 and then $82,000-$82,300 remain the bigger hurdles waiting for anyone betting that the old rally still has gas in the tank.
24-Hour Chart Outlook
Then you open the daily chart, and things get interesting. The same bitcoin that looks tired on the hourly and 4-hour charts is still miles above July’s $57,735 low. That’s the contradiction sitting at the heart of this setup. BTC has been rejected twice around $82,300-$82,800, but the larger recovery hasn’t actually broken.
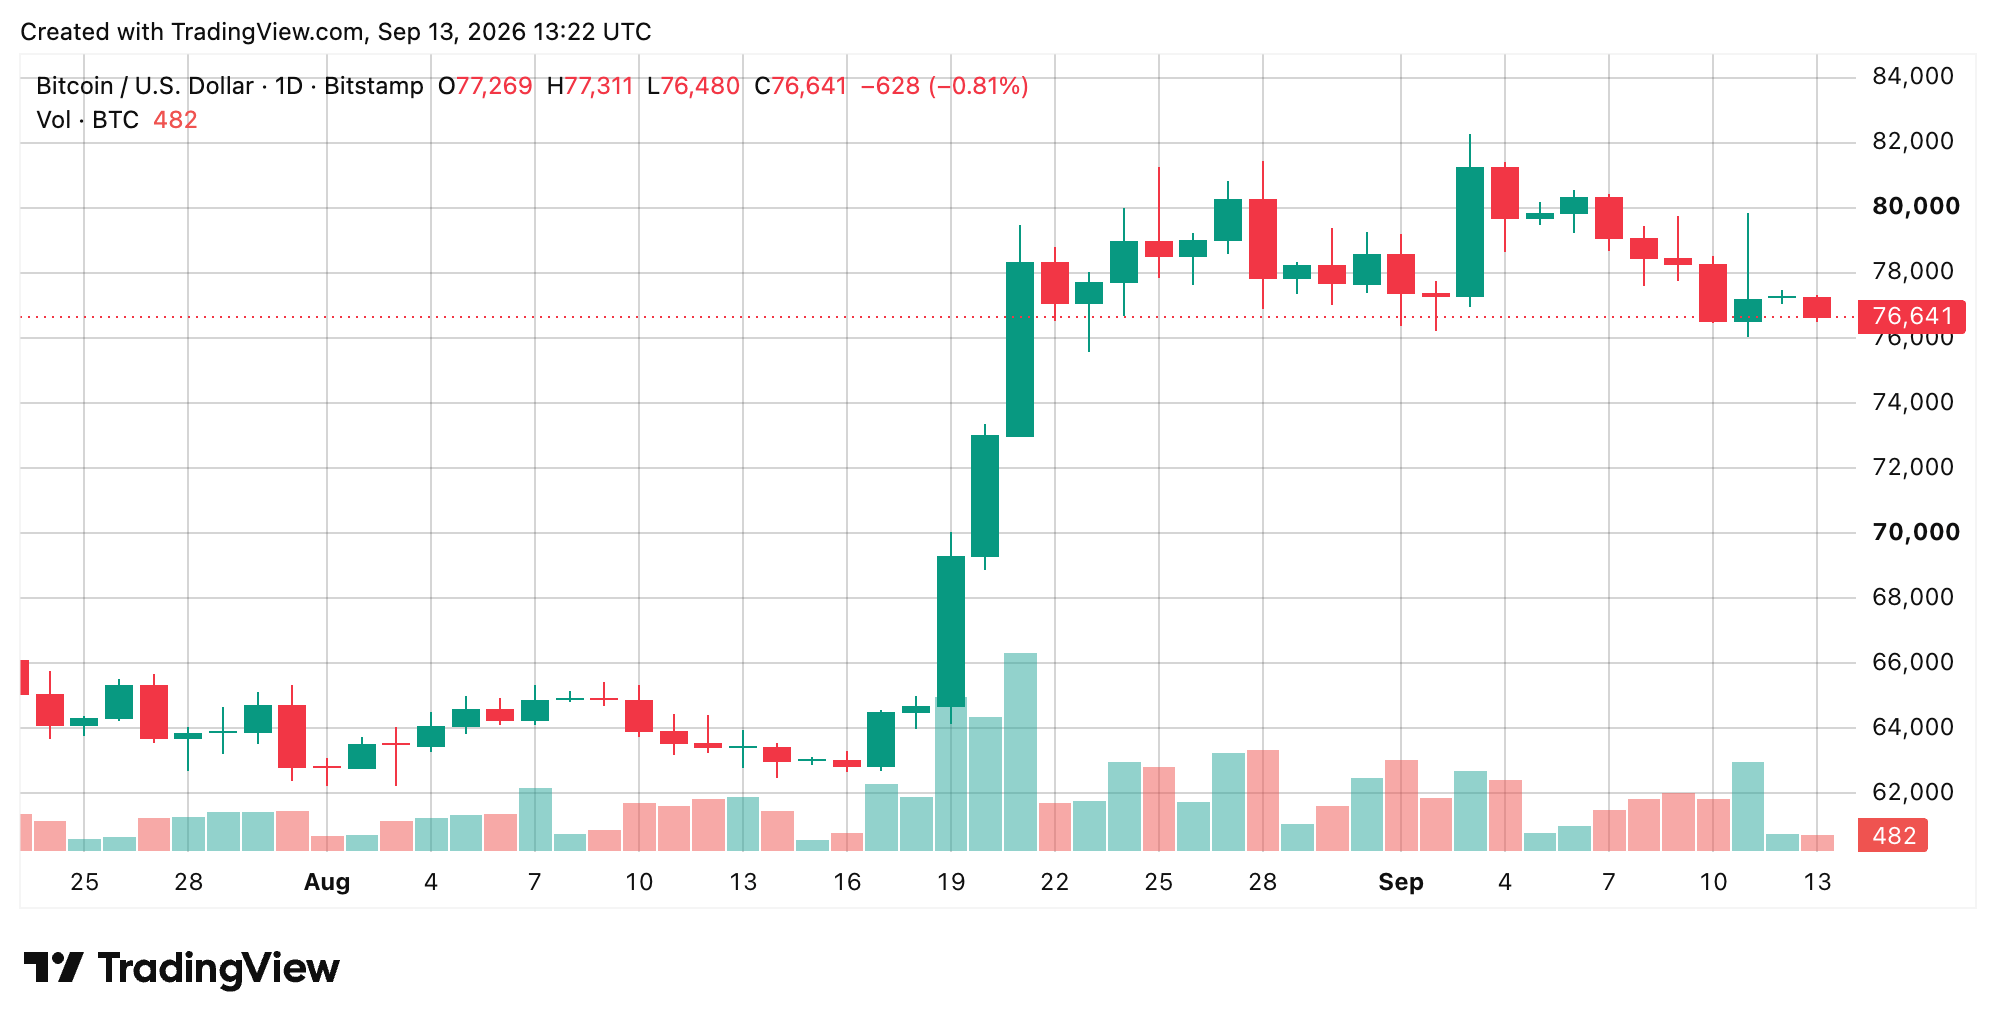 BTC/USD 24-hour chart via Bitstamp on Sept. 13, 2026.
Buyers have continued to defend the $76,000-$76,500 neighborhood, and another layer of support sits around $74,000-$75,200. Meanwhile, the market has a ceiling stretching from roughly $78,500 through $82,800. So while the shorter charts look like they’re running out of steam, the daily chart isn’t throwing in the towel. A convincing reclaim of $78,500 would put buyers in a much better position. A drop below $74,000 would be a considerably different story.
Oscillator Tape Highlights Neutral Signals
The daily chart’s oscillators are basically the market’s way of saying, “Don’t get carried away.” Most aren’t screaming anything at all. The relative strength index (RSI) sits at 53, comfortably neutral, while Stochastic is the lone bullish voice today at 17. The commodity channel index (CCI), average directional index (ADX), Awesome oscillator (AO), Stochastic RSI fast, Williams percent range, bull bear power (BBP), and Ultimate oscillator (UO) are all neutral on Sunday morning.
Then there are two troublemakers: momentum and the moving average convergence divergence (MACD), both of which are bearish. Add everything up, and the oscillator tape has two bearish signals, eight neutral, and just one bullish. That’s hardly a market falling apart, but it isn’t exactly a ringing endorsement either. Most of the dashboard is sitting on the fence while short-term momentum quietly leans toward the bears.
Moving Averages Showcase the Long Game
The moving averages (MAs) are where the plot twist arrives. Bitcoin is below its 10- and 20-period exponential moving averages (EMA), 10- and 20-period simple moving averages (SMA), and 20-period volume weighted moving average (VWMA), which explains why the market feels so heavy right now. Those averages sit roughly between $77,000 and $78,550, forming an overhead traffic jam that bulls have to push through. But travel farther down the list and everything flips.
Bitcoin remains above every listed 30-, 50-, 100- and 200-period EMA and SMA, while the hull moving average (HMA) is bullish and the Ichimoku base line is neutral. The MA clocked averages count nine bullish MAs against five bearish and one neutral. So there it is, bitcoin looks weak when you stand inches from the chart and considerably healthier when you walk across the room. Until BTC either muscles back above roughly $78,500 or cracks below roughly $76,000, this fight is still stuck in the middle. And right now, neither side gets to declare victory.
Bull Verdict
Bitcoin’s bigger trend is still standing even though the short-term charts have taken a beating. Holding the $76,000 area keeps bulls in the fight, but $78,500 is where things really get interesting. Take that level back, and suddenly the bearish momentum starts looking more like a nasty pullback than the beginning of something worse.
Bear Verdict
The bears have the short-term advantage, and bitcoin’s price keeps running into trouble before it can get back above $78,500. If $76,000 finally gives way, that shaky short-term picture gets considerably harder to shrug off, with the $74,000-$75,200 area waiting below. Until buyers prove otherwise, they’re playing defense.