 By crypto.news | Created at 2026-10-19 11:01:53 | Updated at 2026-10-19 12:12:30
1 hour ago
BNB Chain has completed its 37th quarterly token burn, removing 1,646,196.44 BNB worth approximately $1.197 billion as the cryptocurrency trades near $725 and continues struggling below key technical resistance.
Summary
- BNB Chain completed its 37th quarterly burn, permanently removing approximately 1.65 million BNB from circulation today.
- The burn’s $1.197 billion valuation exceeded July’s total, while the token quantity increased approximately 1.88%.
- BNB ranks fourth by market capitalization, trading near $725 despite continued weakness in technical momentum indicators.
- BNB’s remaining supply stands near 131.51 million, leaving approximately 31.51 million tokens above its long-term target.
- Technical indicators identify 700–703 as immediate support, with buyers facing resistance around the 750–752 region.
According to the BNB Foundation’s October 19 announcement, the burn took place directly on BNB Smart Chain and reduced the reported total supply to 131,512,085 BNB. The foundation recorded the figures at 10:05 a.m. UTC, with the network continuing its supply-reduction program toward 100 million tokens.
At press time, BNB traded at approximately $725.45, gaining around 0.5% in 24 hours. Its market capitalization stood near $95.42 billion, placing it fourth among cryptocurrencies, while daily trading volume reached approximately $705.68 million.
The latest burn has not been accompanied by a substantial price rally in the available market snapshot. BNB remains below the $750 region identified by the supplied daily technical analysis as an important resistance area.
BNB Chain burns more tokens than in its previous quarterly event
The October burn removed more tokens than the previous event in July, when the BNB Foundation destroyed 1,615,827.795 BNB worth approximately $931.7 million.
Based on the foundation’s 36th quarterly burn figures, the latest operation removed an additional 30,368.645 BNB. This represents an increase of approximately 1.88% in the quantity burned between the two quarters.
The value of the October operation rose by approximately $265.6 million, or 28.5%, compared with July. The difference reflects both the additional tokens destroyed and the higher BNB price used to value the latest burn.
July’s reported figures imply a price of approximately $576.61 per token at the time of that operation, compared with roughly $727.34 for October. These are calculated valuations based on the foundation’s announcements, not average market prices across the respective quarters.
As previously covered by crypto.news, the 36th quarterly supply reduction left approximately 133.17 million BNB outstanding in July. The October announcement puts the total supply near 131.51 million, continuing the programmed reduction.
The foundation conducts quarterly burns through its Auto-Burn mechanism, which determines how much BNB should be removed using a defined formula. The mechanism operates independently of the Binance centralized exchange and does not represent a new $1.197 billion purchase of tokens on the open market.
BNB supply moves closer to its 100 million target
The BNB Foundation’s supply-reduction program is designed to continue until the total supply reaches 100 million BNB.
Following the latest event, approximately 31.51 million tokens remain above that target. Reaching the goal would require removing roughly 24% of the currently reported supply.
The October burn itself represents approximately 1.24% of the supply immediately before the operation, calculated using the announced amount destroyed and the remaining balance.
BNB Chain uses an Auto-Burn formula that accounts for market prices and parameters related to the relevant quarter. The system determines burn quantities according to its published rules instead of requiring a separate discretionary decision about how many tokens to destroy each quarter.
The foundation explained that the Lorentz and Maxwell network upgrades changed the speed at which BNB Smart Chain produces blocks. Parameters used in the burn formula have therefore been adjusted to preserve the intended mechanism as block production becomes faster.
Under the network’s technical approach, the calculation takes account of the time covered by each quarter alongside the reference price of BNB. Future token reductions will depend on the applicable inputs, so the number of burns required to reach the supply target is not fixed.
A separate real-time mechanism, BEP-95, destroys part of the transaction fees collected on BNB Smart Chain. The burn ratio is determined through validator governance, allowing the amount removed through this process to vary with transaction activity.
The foundation sends quarterly burn tokens to the designated blackhole address, 0x000000000000000000000000000000000000dEaD. Quarterly burns have occurred directly on BNB Smart Chain since the BNB Chain Fusion process changed the network’s earlier structure.
BNB price stays below $750 as bearish indicators persist
Despite the latest supply reduction, BNB’s daily chart continues to show signs of weak buying momentum.
CoinGecko’s data show BNB near $725.45, with approximately 131.51 million tokens circulating and a market value of $95.42 billion. The price remains below the 750–752 resistance area identified in the supplied technical analysis.
The chart snapshot places BNB’s 20-day simple moving average at $751.70, with the upper Bollinger Band at $800.51 and the lower band at $702.89. Trading beneath the moving average and closer to the lower band indicates that the recent price recovery has not yet overcome the preceding downward pressure.
Bollinger Bands measure how far prices are moving from a central moving average using historical volatility. A price near the lower band can indicate weakness, although the indicator alone cannot establish whether a reversal or further decline will follow.
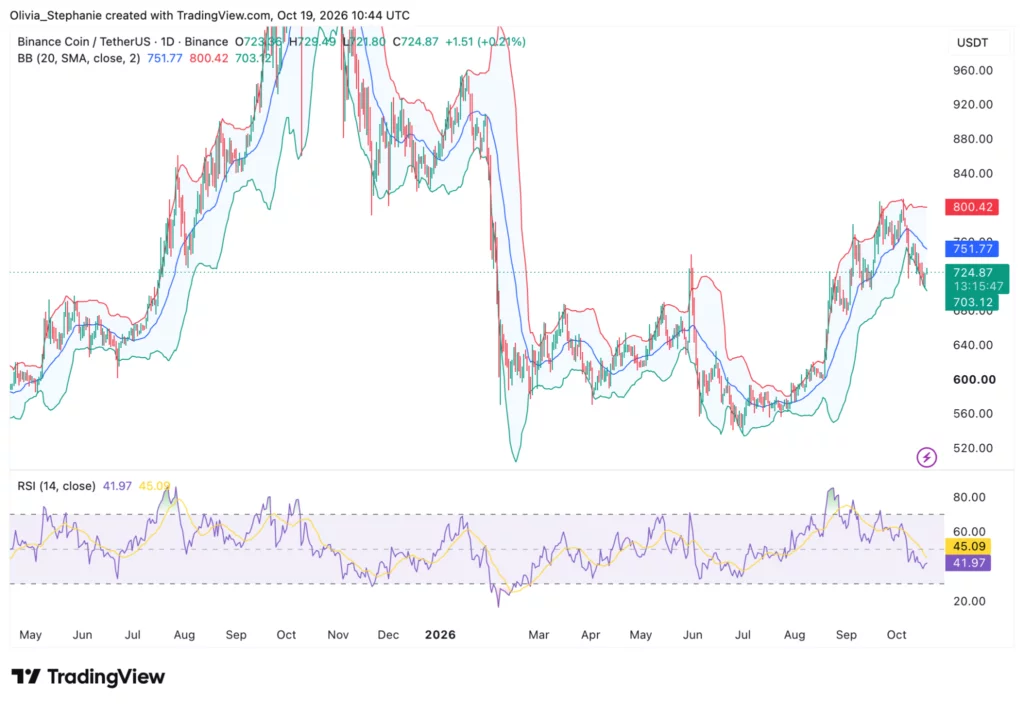 BNB price chart, source: TradingView
The Relative Strength Index stood at 41.32, below its moving average of 45.04 and the neutral level of 50. This suggests that buying momentum remains weaker than selling momentum, despite the token’s modest daily recovery.
The RSI remains above the traditional oversold threshold of 30, meaning the indicator has not yet reached the level commonly associated with heavily oversold trading conditions.
BNB’s recent decline followed a rejection near $800, according to the technical snapshot. Sellers have kept the token below its 20-day moving average, leaving the $750 area as an important reference point for traders watching a possible recovery.
BNB technical analysis identifies $700 support and $800 resistance
The immediate support region lies between $700 and $703, close to the lower Bollinger Band at $702.89.
A sustained move below that region could expose BNB to further selling toward $680, followed by $640 if weakness continues. These levels represent technical scenarios based on the supplied chart, not confirmed future prices.
For a recovery, buyers would first need to push BNB above 750–752, where the 20-day moving average creates an initial obstacle. Stronger resistance appears between $780 and $800, including the area where the cryptocurrency previously faced selling pressure.
A sustained recovery above the moving average, supported by improving RSI readings, would provide more evidence that buying momentum is returning. A brief move above resistance without follow-through would offer weaker confirmation.
The price has remained under pressure over the previous week, despite the daily improvement. CoinGecko’s seven-day performance reading showed BNB approximately 3.3% lower, consistent with the recent decline identified in the technical analysis.
The supply reduction and the price indicators measure different developments: the foundation has confirmed the tokens removed from circulation, while the chart records how BNB is trading in the market. Neither the burn’s reported dollar value nor the daily price change establishes a direct causal relationship between the two.
The foundation’s October release lists the completed burn quantity, its estimated dollar value and the remaining supply. It does not provide a statistical analysis measuring whether quarterly burns have caused BNB prices to rise after previous events.
Disclosure: This article does not represent investment advice. The content and materials featured on this page are for educational purposes only.