 By CryptoPotato | Created at 2026-08-11 22:22:05 | Updated at 2026-08-11 23:04:03
7 hours ago
By CryptoPotato | Created at 2026-08-11 22:22:05 | Updated at 2026-08-11 23:04:03
7 hours ago
Ethereum is consolidating around the $1.8K area after recovering from its June lows, but the broader structure remains under pressure. The daily chart shows ETH trading below important moving averages, while the 4-hour chart suggests that the recent recovery has entered a range. Meanwhile, the exchange supply ratio has continued to decline, pointing to a shrinking amount of ETH held on exchanges.
Ethereum Price Analysis: The Daily Chart
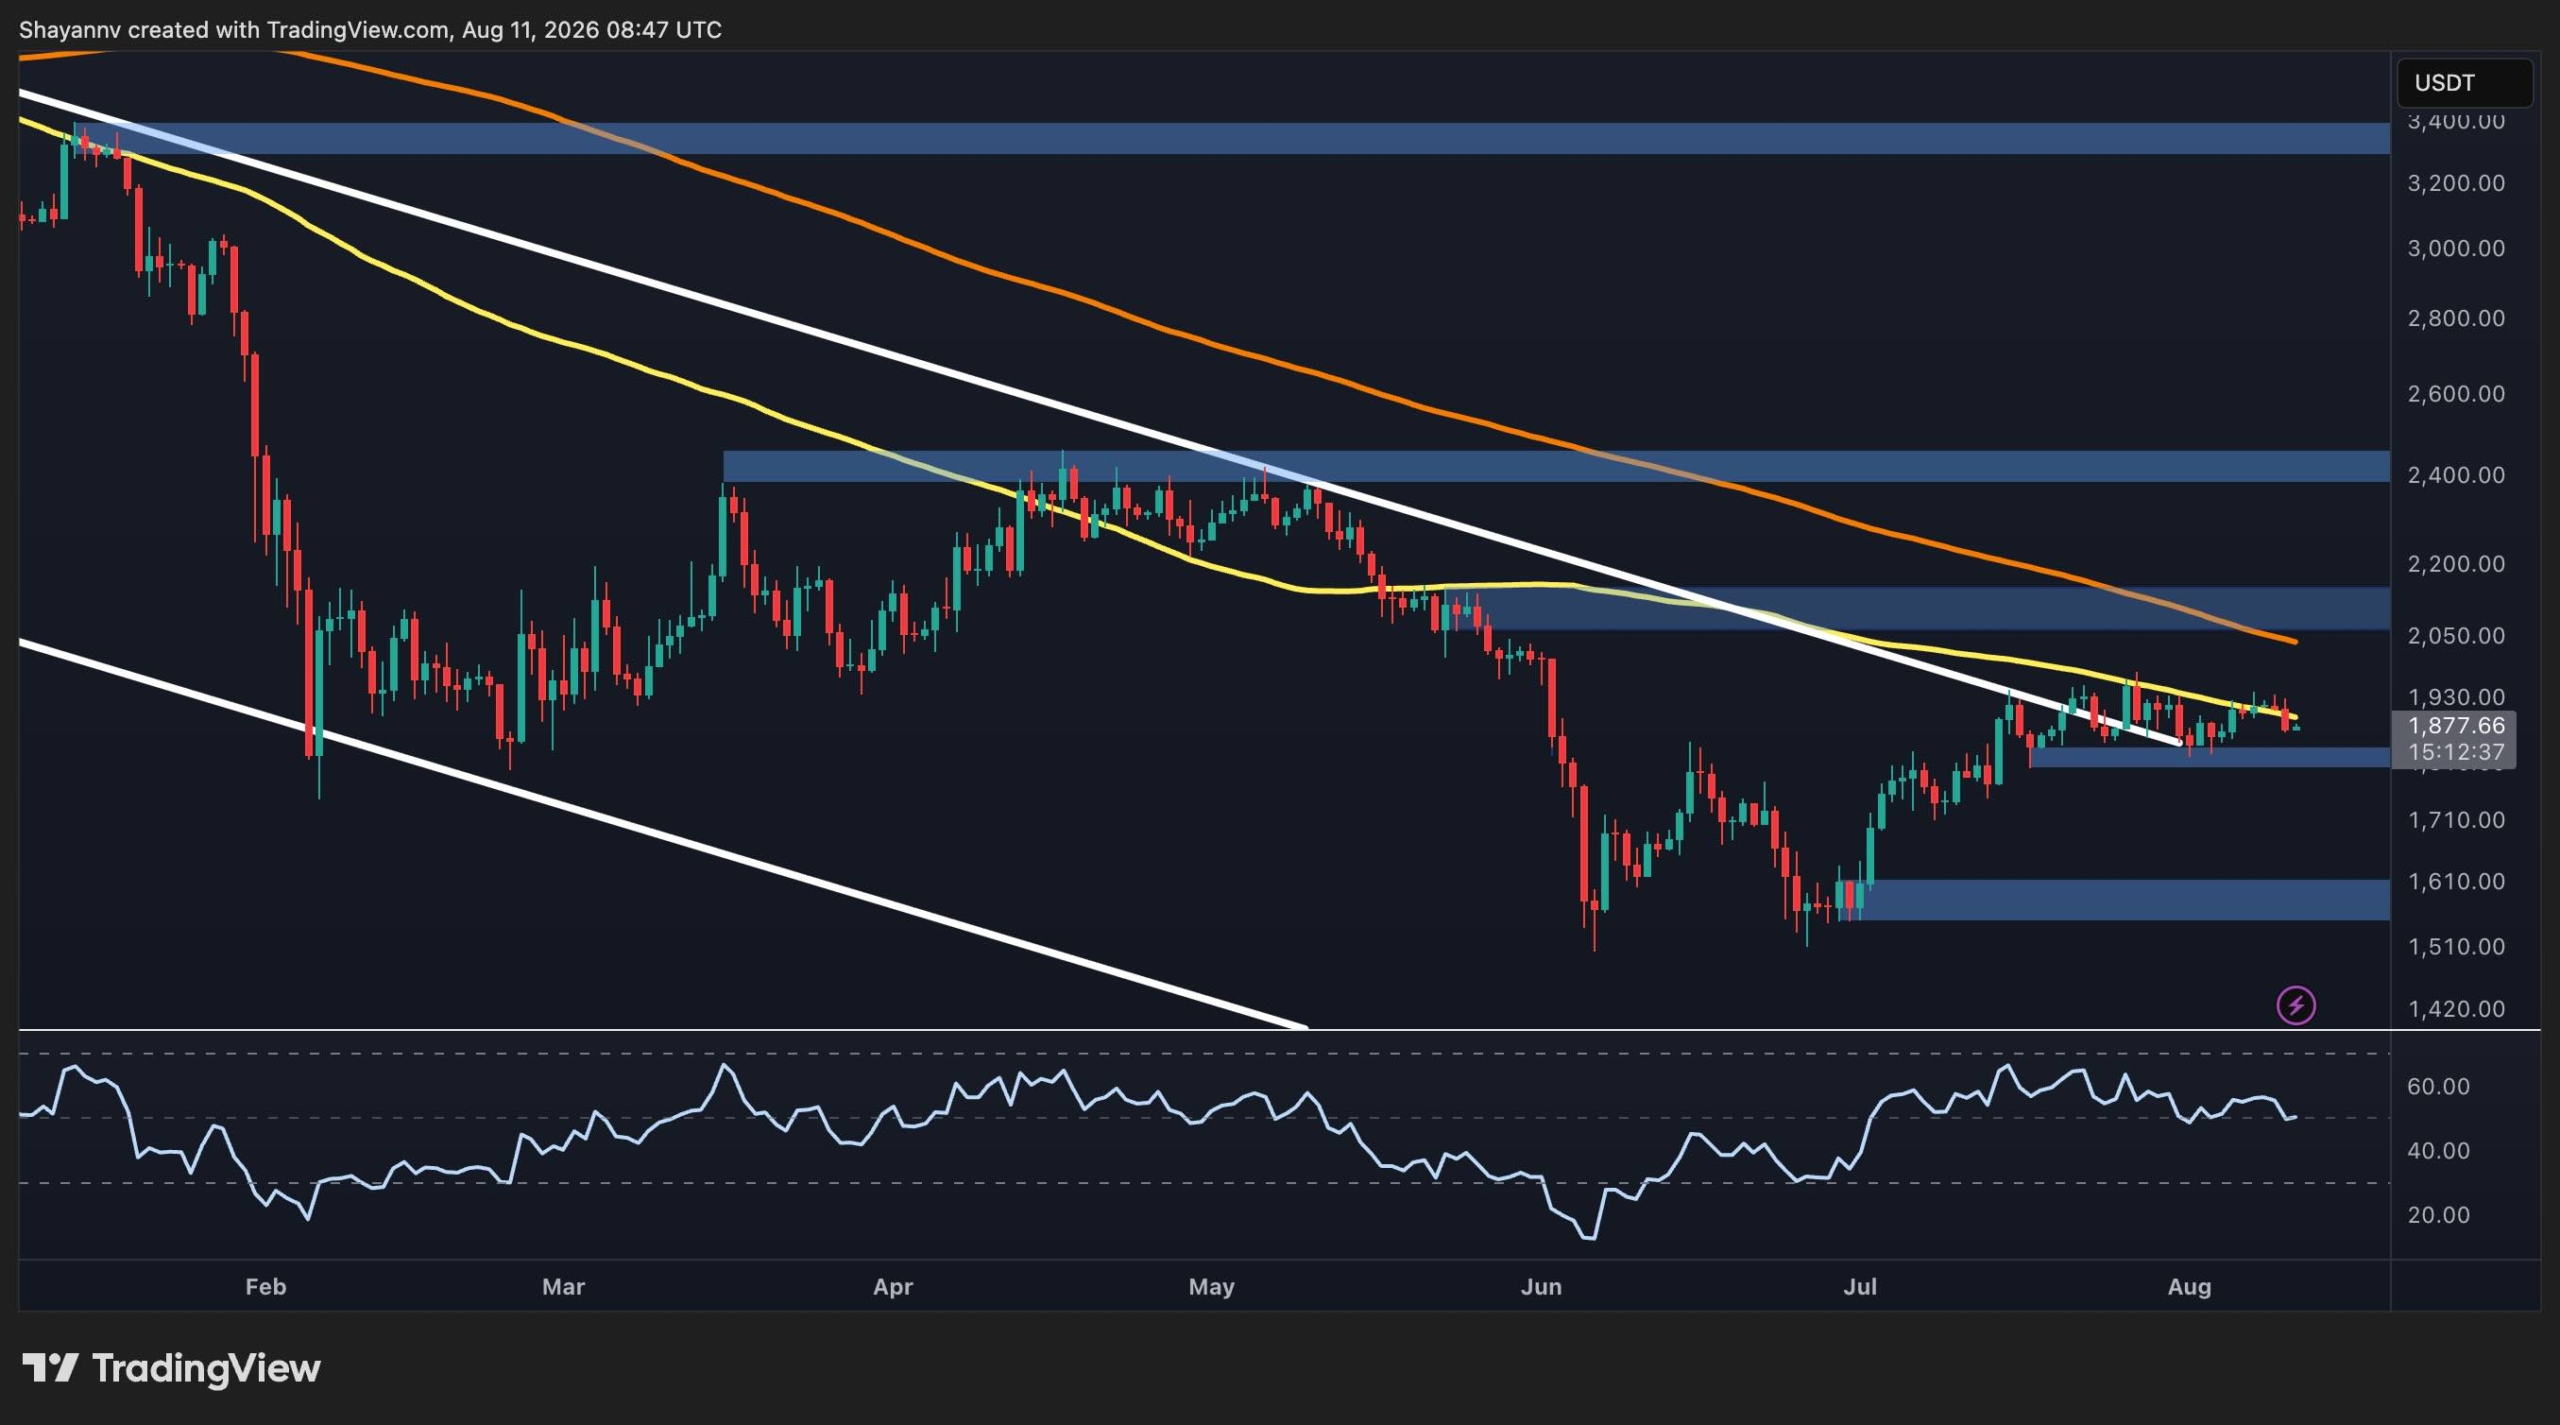
ETH is currently trading around $1.88K, with the daily structure still characterized by a series of lower highs from the earlier 2026 peak. The price remains below the descending white trendline, which has acted as dynamic resistance, as well as below the higher moving averages shown on the chart. The 100-day moving average is currently around $1.9K, making the region an important near-term resistance zone.
The latest price action appears to be forming a consolidation just below this resistance. A sustained daily breakout above the moving average and the $2.1K resistance zone would provide the first meaningful indication that the overall corrective structure is shifting. Above that area, the next major resistance sits around $2.4K, which is a key area for ETH’s recovery.
On the downside, the most immediate support is around the $1.8K short-term lows. This area is particularly important because ETH has repeatedly found buyers around it during the recent consolidation. A daily breakdown below this zone could expose the next support around $1.6K, which previously triggered the latest recovery, and would lead to a drop back into the broken descending channel, making the recent rally just another fake breakout.
ETH/USDT 4-Hour Chart
The 4-hour chart provides a somewhat more constructive picture. ETH has been moving inside a broad ascending channel since the June low, with the lower boundary gradually rising. The recovery pushed price toward the $1.96K resistance zone, but ETH failed to break through and has since pulled back toward the $1.8K support area.
The latest decline has brought the 4-hour RSI down toward the mid-to-lower range, indicating that short-term momentum has weakened following the rejection. However, the indicator is not yet showing an extreme oversold reading, leaving room for another test of the nearby support.
Holding $1.8K would keep the short-term bullish structure intact and could allow ETH to retest the $1.96K level. A successful breakout above that zone would open the way toward the upper channel boundary and the $2K resistance area.
Conversely, a decisive 4-hour close below $1.83K would weaken the current recovery structure. In that scenario, ETH could retrace toward the next support around $1.71K-$1.75K, while the broader demand zone around $1.62K would become relevant if selling pressure accelerates.
Overall, the 4-hour structure remains constructive as long as the $1.83K area holds, but ETH needs to reclaim the $1.96K-$2.05K region to establish a stronger bullish continuation.

On-Chain Analysis
The exchange supply ratio chart shows a notable divergence between ETH’s price and the amount of supply held on exchanges. The ratio has declined steadily from roughly 0.18 in mid-2025 to around 0.127 currently, while ETH is trading near $1.8K.
A declining exchange supply ratio generally means that a smaller share of ETH’s circulating supply is sitting on exchanges. This can reduce the amount of ETH immediately available for spot selling and can therefore provide a constructive longer-term backdrop, particularly if demand returns.
The chart also shows that the exchange supply ratio continued falling even as ETH recovered from the $1.5K area toward $1.8K. This suggests that the recent recovery has not been accompanied by a significant increase in exchange-held supply.
However, the metric should not be interpreted as a standalone bullish signal. Coins can leave exchanges for many reasons, including long-term custody and staking, and the declining ratio does not by itself confirm stronger demand. From a price perspective, ETH still needs to overcome the $2K resistance region to turn the improving on-chain backdrop into a clearer technical recovery.

Disclaimer: Information found on CryptoPotato is those of writers quoted. It does not represent the opinions of CryptoPotato on whether to buy, sell, or hold any investments. You are advised to conduct your own research before making any investment decisions. Use provided information at your own risk. See Disclaimer for more information.