By crypto.news | Created at 2026-08-07 13:41:27 | Updated at 2026-08-07 15:31:15
2 hours ago
By crypto.news | Created at 2026-08-07 13:41:27 | Updated at 2026-08-07 15:31:15
2 hours ago
HYPE price climbed above $56.80 as strong quarterly revenue, token buybacks, and rising RWA trading activity helped it rebound from the $51 support area.
Summary
- HYPE price gained 2.5% in 24 hours and traded about 3.7% higher over the past week.
- Hyperliquid generated $169 million in Q2 revenue, allocating $141 million to HYPE buybacks.
- The daily chart shows a potential breakout from a descending channel, but momentum is nearing overbought levels.
- Liquidation clusters at $57.20 and $55 could determine HYPE’s next short-term move.
HYPE price rebounds from $51 support
According to data from crypto.news, Hyperliquid (HYPE) price traded near $56.80 on Aug. 7, gaining about 2.5% over 24 hours after recovering from an early-August low around $51.20. The token reached an intraday high near $57.04 before buyers and sellers began competing around the $57 level.
The rebound has lifted HYPE roughly 11% from its weekly low, although its net seven-day gain remained closer to 3.7%. Trading volume stood near $250 million over the previous 24 hours.
The 4-hour chart shows HYPE establishing a sequence of higher lows after defending the $51–$52 region. Price has also moved above the Supertrend indicator, which currently provides dynamic support near $54.44.
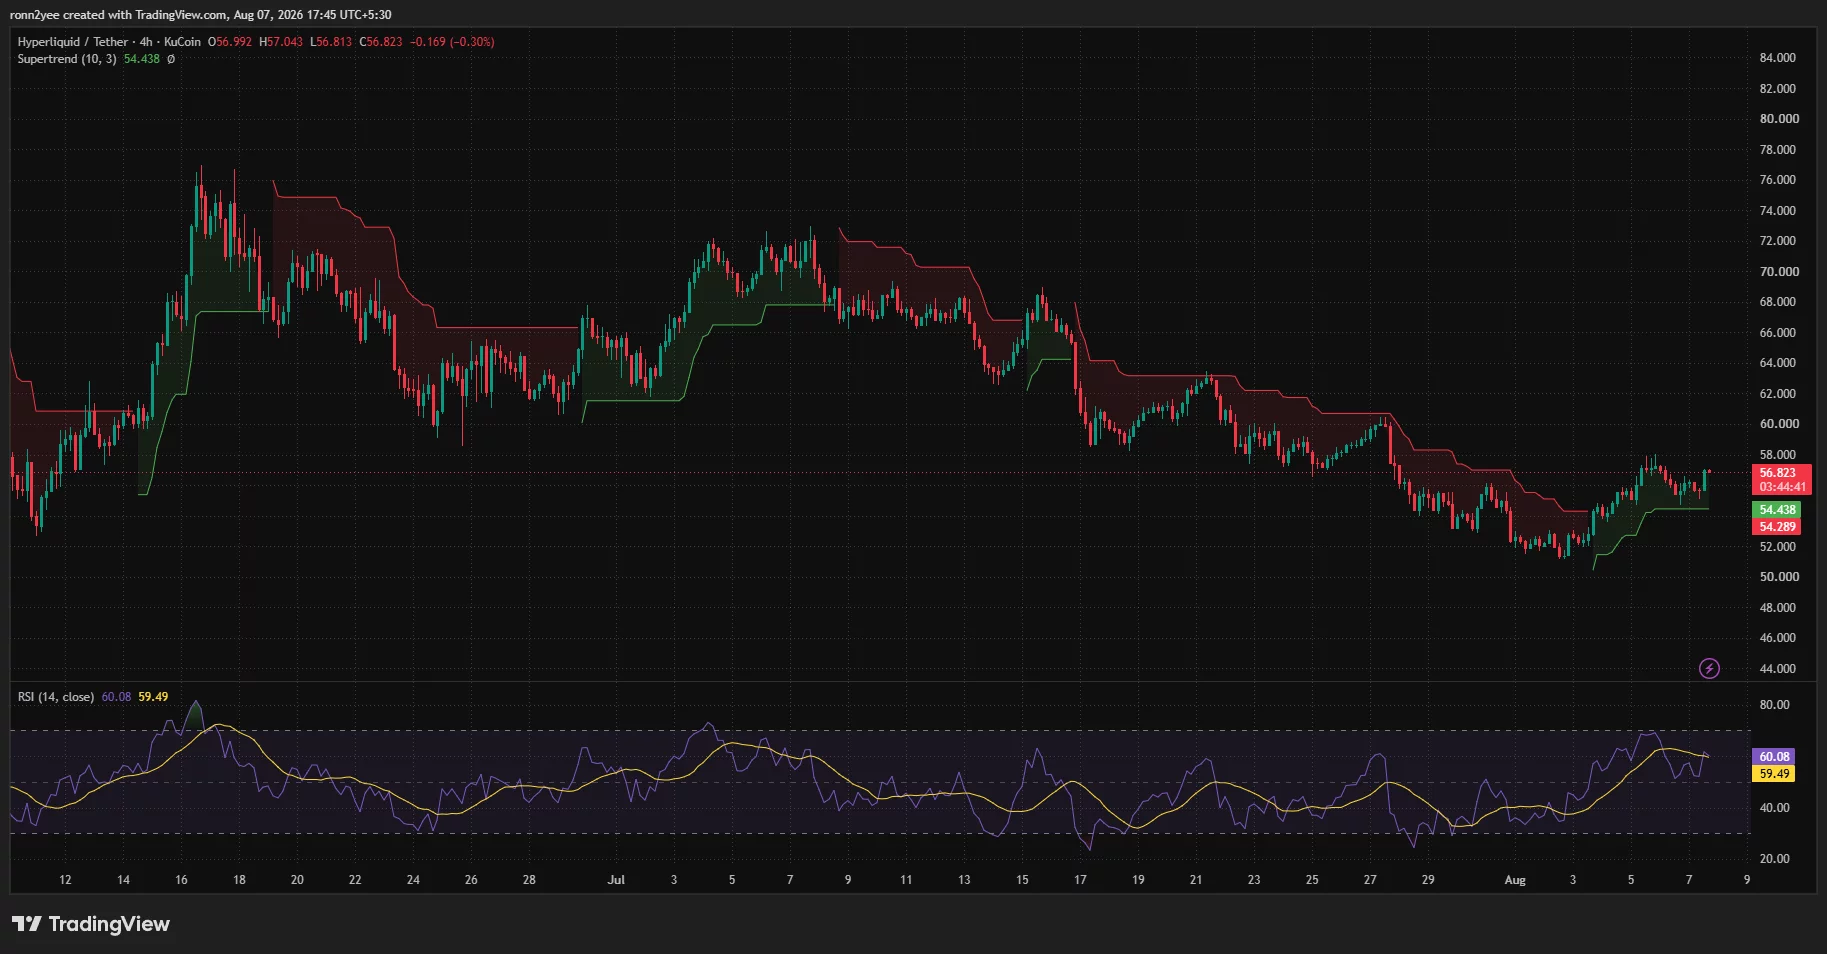 Hyperliquid price 4-hour chart — Aug. 7 | Source: crypto.news
The 4-hour relative strength index stood at 60.08, slightly above its signal average of 59.49. This reading points to improving buying pressure without placing HYPE in overbought territory on the shorter timeframe.
However, the token remains about 26% below its June record near $76.70. The broader chart therefore shows a recovery within a larger correction rather than a confirmed return to its previous uptrend.
Hyperliquid buybacks support the recovery
The latest move followed the release of Hyperliquid’s second-quarter performance figures. The protocol reported $169 million in quarterly revenue and said $141 million was directed toward HYPE buybacks.
Hyperliquid also passed $1 billion in cumulative protocol revenue during the quarter. HIP-3 real-world asset perpetual contracts generated $213 billion in trading volume and represented 32.2% of activity in the category covered by the report.
RWA trading contributed 6.6% of total quarterly revenue, according to the Q2 figures. The data strengthened the view that Hyperliquid is expanding beyond crypto perpetual futures into tokenized commodities, equities and other traditional-market products.
Buybacks can support HYPE by creating recurring demand using protocol revenue. Still, their effect depends on whether platform trading activity and fee generation remain high enough to offset token sales and future supply growth.
HYPE’s fully diluted valuation stood near $54 billion, compared with a circulating market capitalization of approximately $12.6 billion. That gap remains a longer-term risk because only part of the maximum token supply currently circulates.
HYPE price faces $57.30 liquidation wall
The daily chart shows HYPE attempting to move above the upper boundary of a descending channel that has guided price lower since early July. A sustained daily close above $57 would strengthen the breakout case.
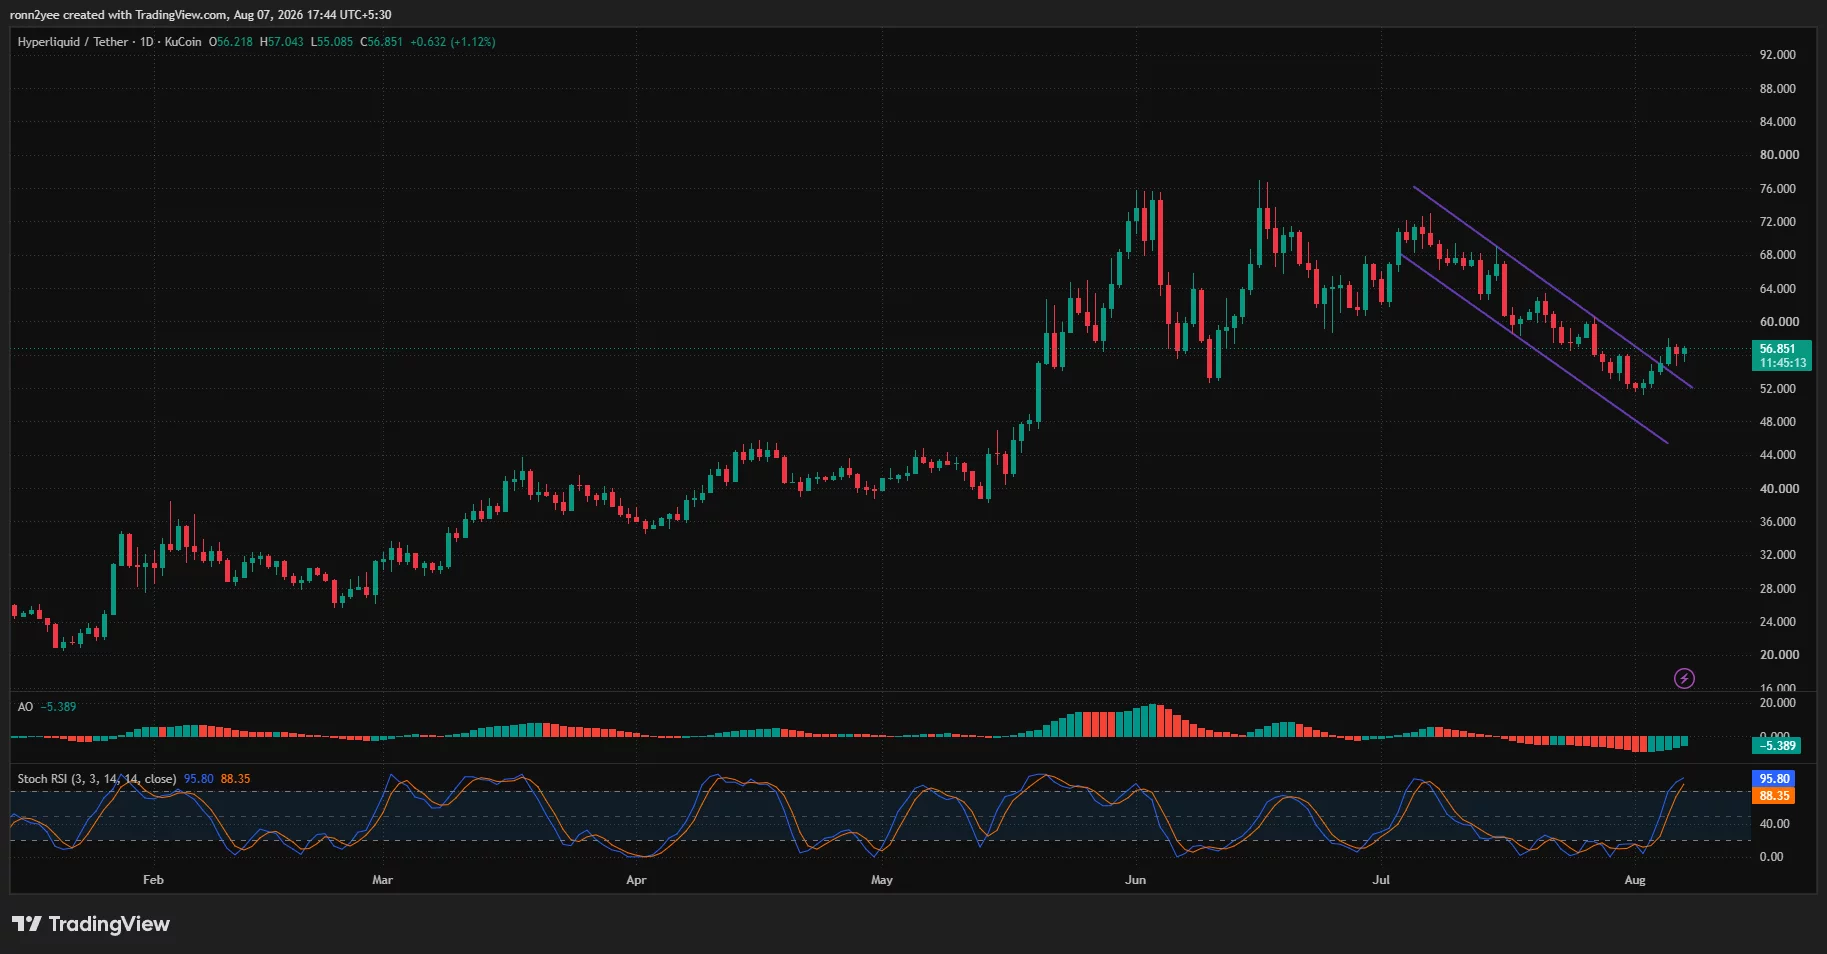 Hyperliquid price daily chart — Aug. 7 | Source: crypto.news
The Awesome Oscillator remained negative at -5.39, showing that the broader momentum structure has not fully turned bullish. Its histogram bars have nevertheless shifted higher, indicating that bearish momentum is weakening.
The Stochastic RSI presents a more immediate warning. Its two lines stood at 95.80 and 88.35, placing the indicator deep in overbought territory. That setup does not guarantee a decline, but it raises the chance of consolidation or a short pullback before another advance.
CoinGlass’ 24-hour liquidation heatmap shows the largest nearby liquidity concentration above the market at approximately $57.20–$57.35. A move through that zone could force leveraged short positions to close and push HYPE toward $58 and $60.
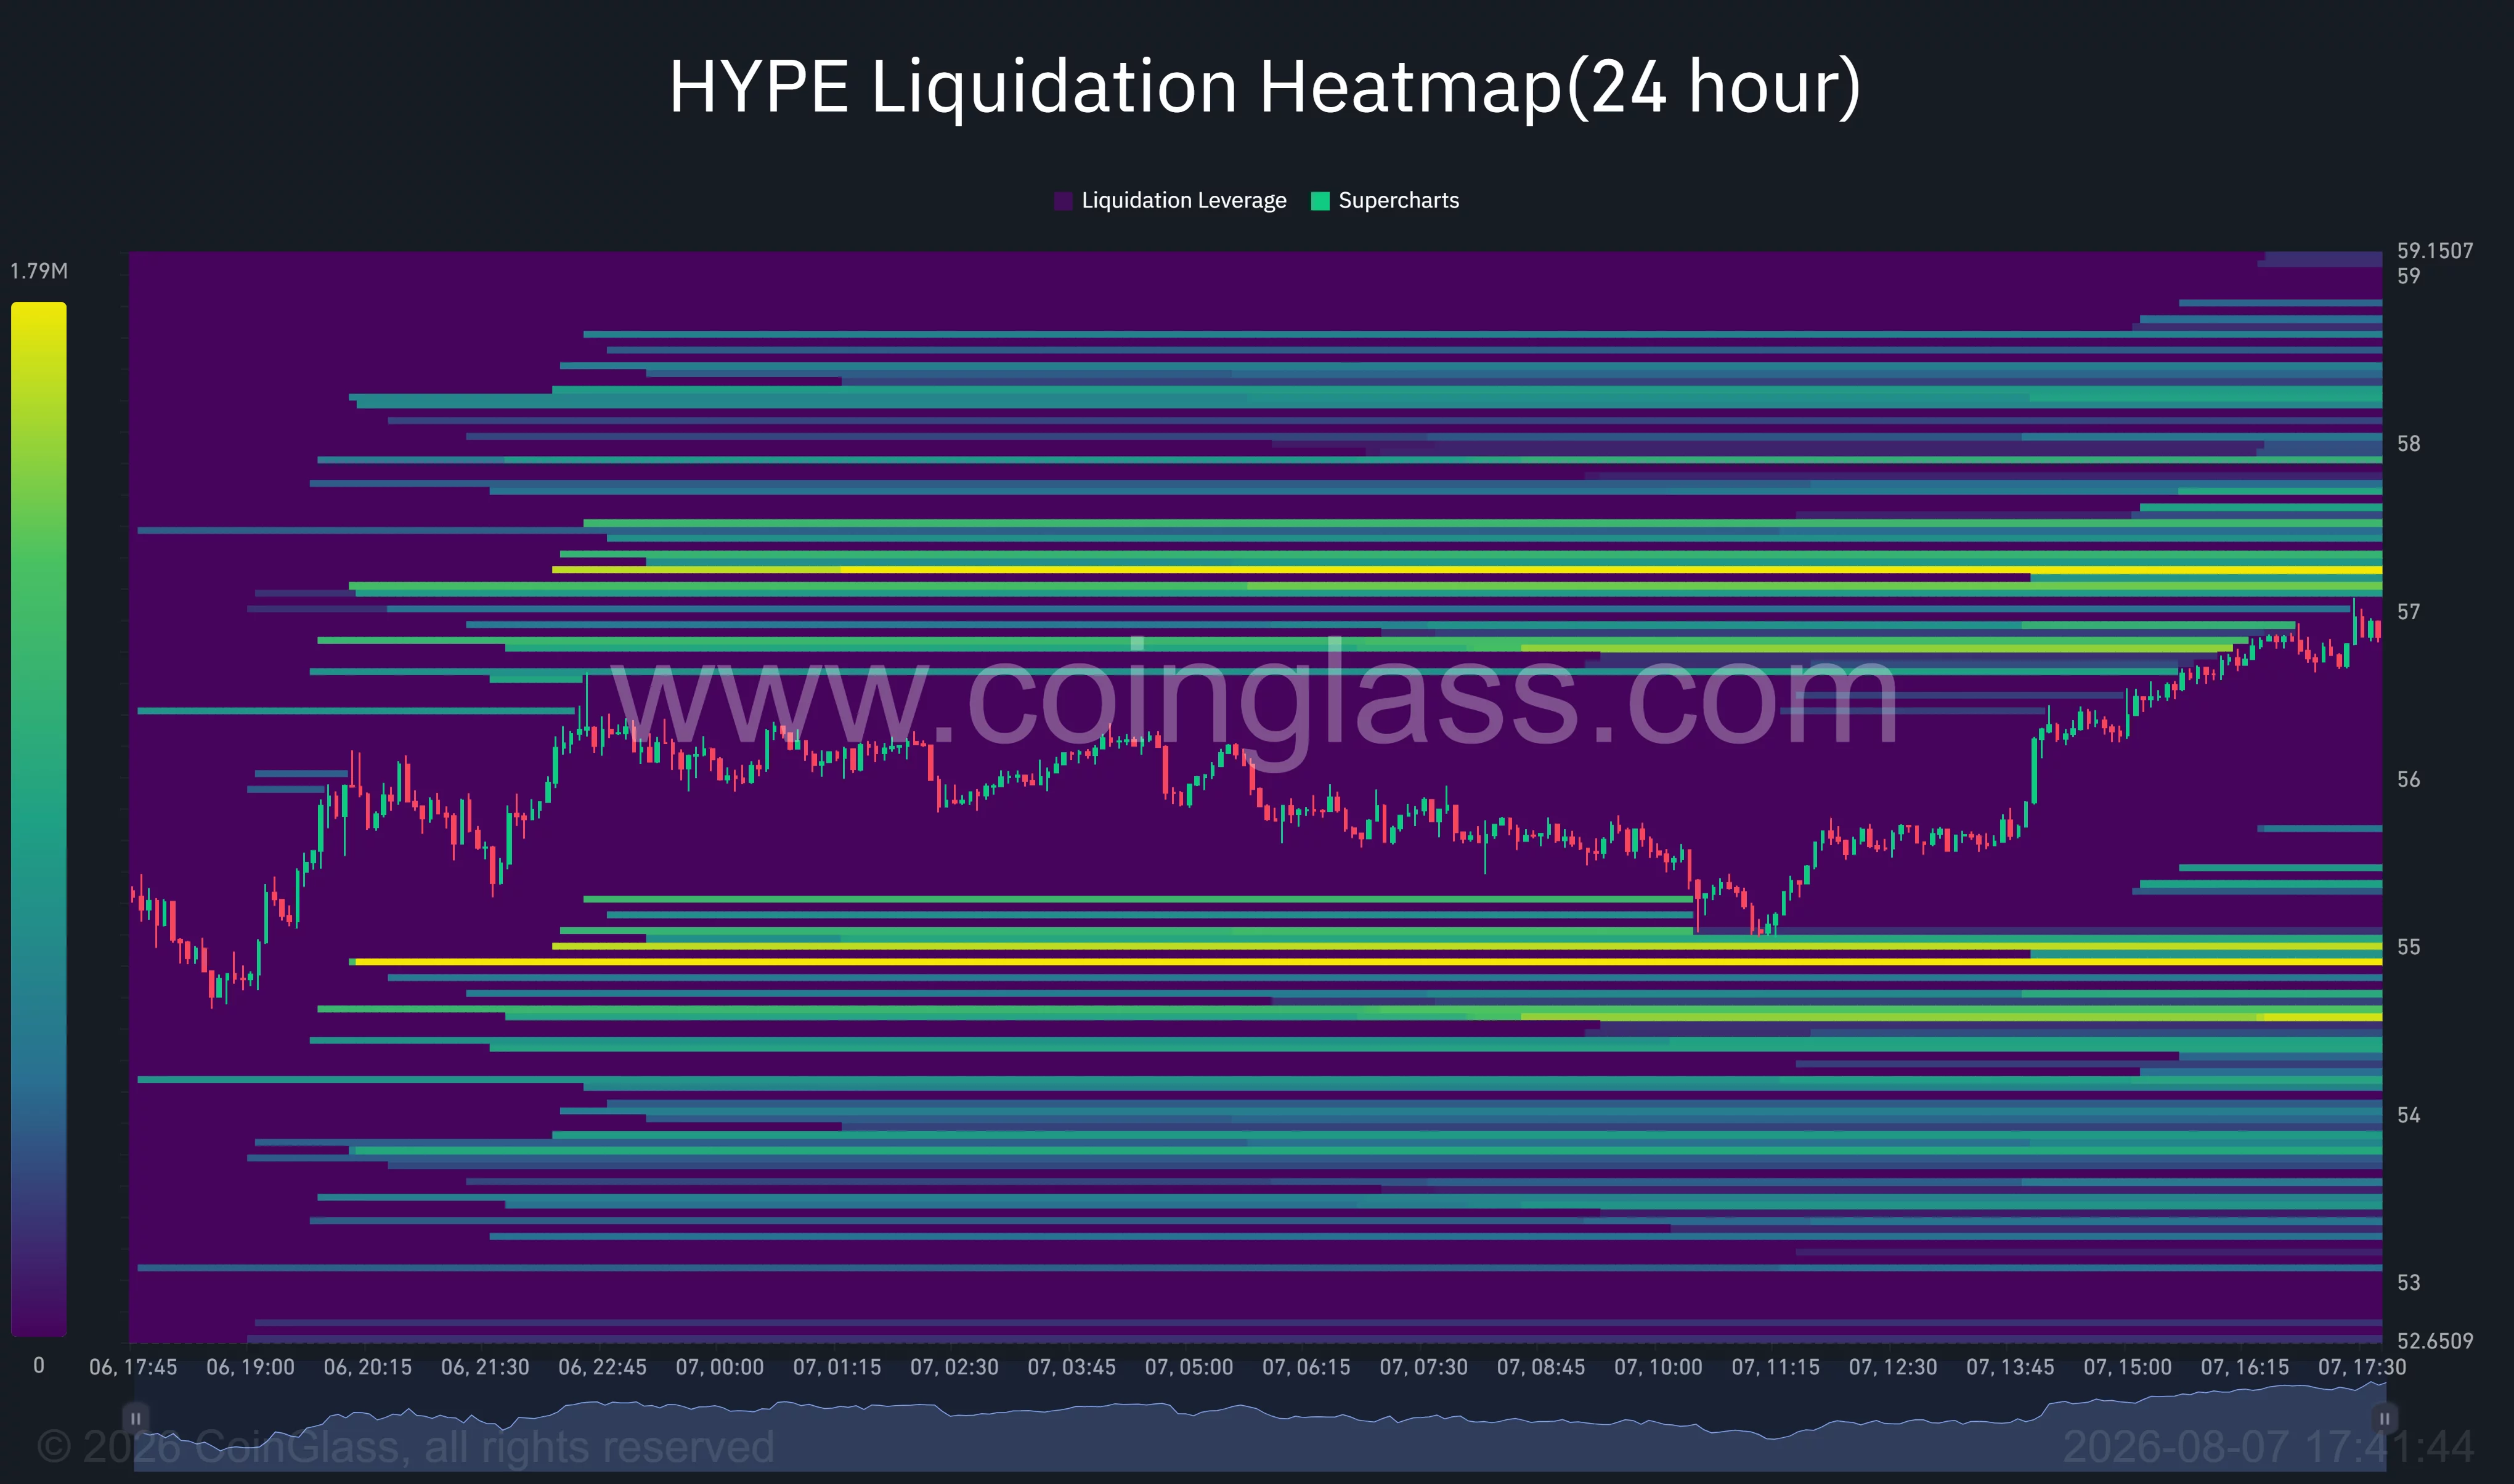 Hyperliquid liquidation chart | Source: CoinGlass
Below the current price, another major liquidation cluster sits around $54.90–$55. Losing that area could accelerate a decline toward the 4-hour Supertrend support at $54.44. The next lower zones are $52 and the recent low near $51.
Analysts Split Over HYPE’s Next Target
Crypto trader Altcoin Sherpa said HYPE may be building a bottom near its current range, although he expected the outcome to depend on wider market conditions.
“The level to watch is still $50; lose that and I think we see low/mid $40s in a slow fashion,” he wrote in an Aug. 6 post.
The analyst added that he remained constructive on HYPE over the longer term. His chart placed a broader demand zone across the low-to-mid-$40 region if the $50 floor fails.
HypeDojo offered a more bullish scenario, comparing the latest $51.50 bottom with the token’s earlier rebound from $52.50 to its June record. The trader projected a possible move toward $80 by the end of August.
Can we expect a $HYPE ATH in August??
In early and mid-June, we saw two $HYPE ATHs, and although there was a profile of an ATH in July, it ended with a Monthly High with the BTC Market Crash.
In early August, that means we are currently in a Bottom. After the first ATH in June,… pic.twitter.com/5bnrCMiibP
That target would require HYPE to clear several resistance areas, including $60, $64, $68 and the previous record around $76.70. The overbought daily Stochastic RSI also suggests that such a move may not develop in a straight line.
US competition adds risk to HYPE outlook
JPMorgan analysts have warned that momentum in HYPE-linked investment products weakened after strong inflows during May and June. A reported 12-session outflow streak reached approximately $29.8 million through Aug. 3.
The bank also pointed to competition from regulated derivatives and prediction-market platforms, according to Blockhead. That risk is particularly relevant in the United States, where regulated venues are expanding access to perpetual-style contracts.
For now, the HYPE price outlook depends on whether buyers can convert the rebound into a confirmed daily channel breakout. A close above $57.30 would open a path toward $60, while rejection and a break below $54.40 would bring $52 and $50 back into focus.
Disclosure: This article does not represent investment advice. The content and materials featured on this page are for educational purposes only.