Sign up to the Independent Climate email for the latest advice on saving the planet
Get our free Climate email
Get our free Climate email
I would like to be emailed about offers, events and updates from The Independent. Read our privacy policy
New satellite images show the extreme melting that has taken place on the critical Greenland ice sheet, according to researchers.
The sheet is a mass of glacial land ice and is an integral part of Earth’s climate system helping to reflect the sun’s warm rays and keep the Arctic cool, regulating sea level, and influencing weather.
Now, scientists have used NASA and European Space Agency satellites to reveal the sheet’s thinning and record the first measurements of its change over recent years.
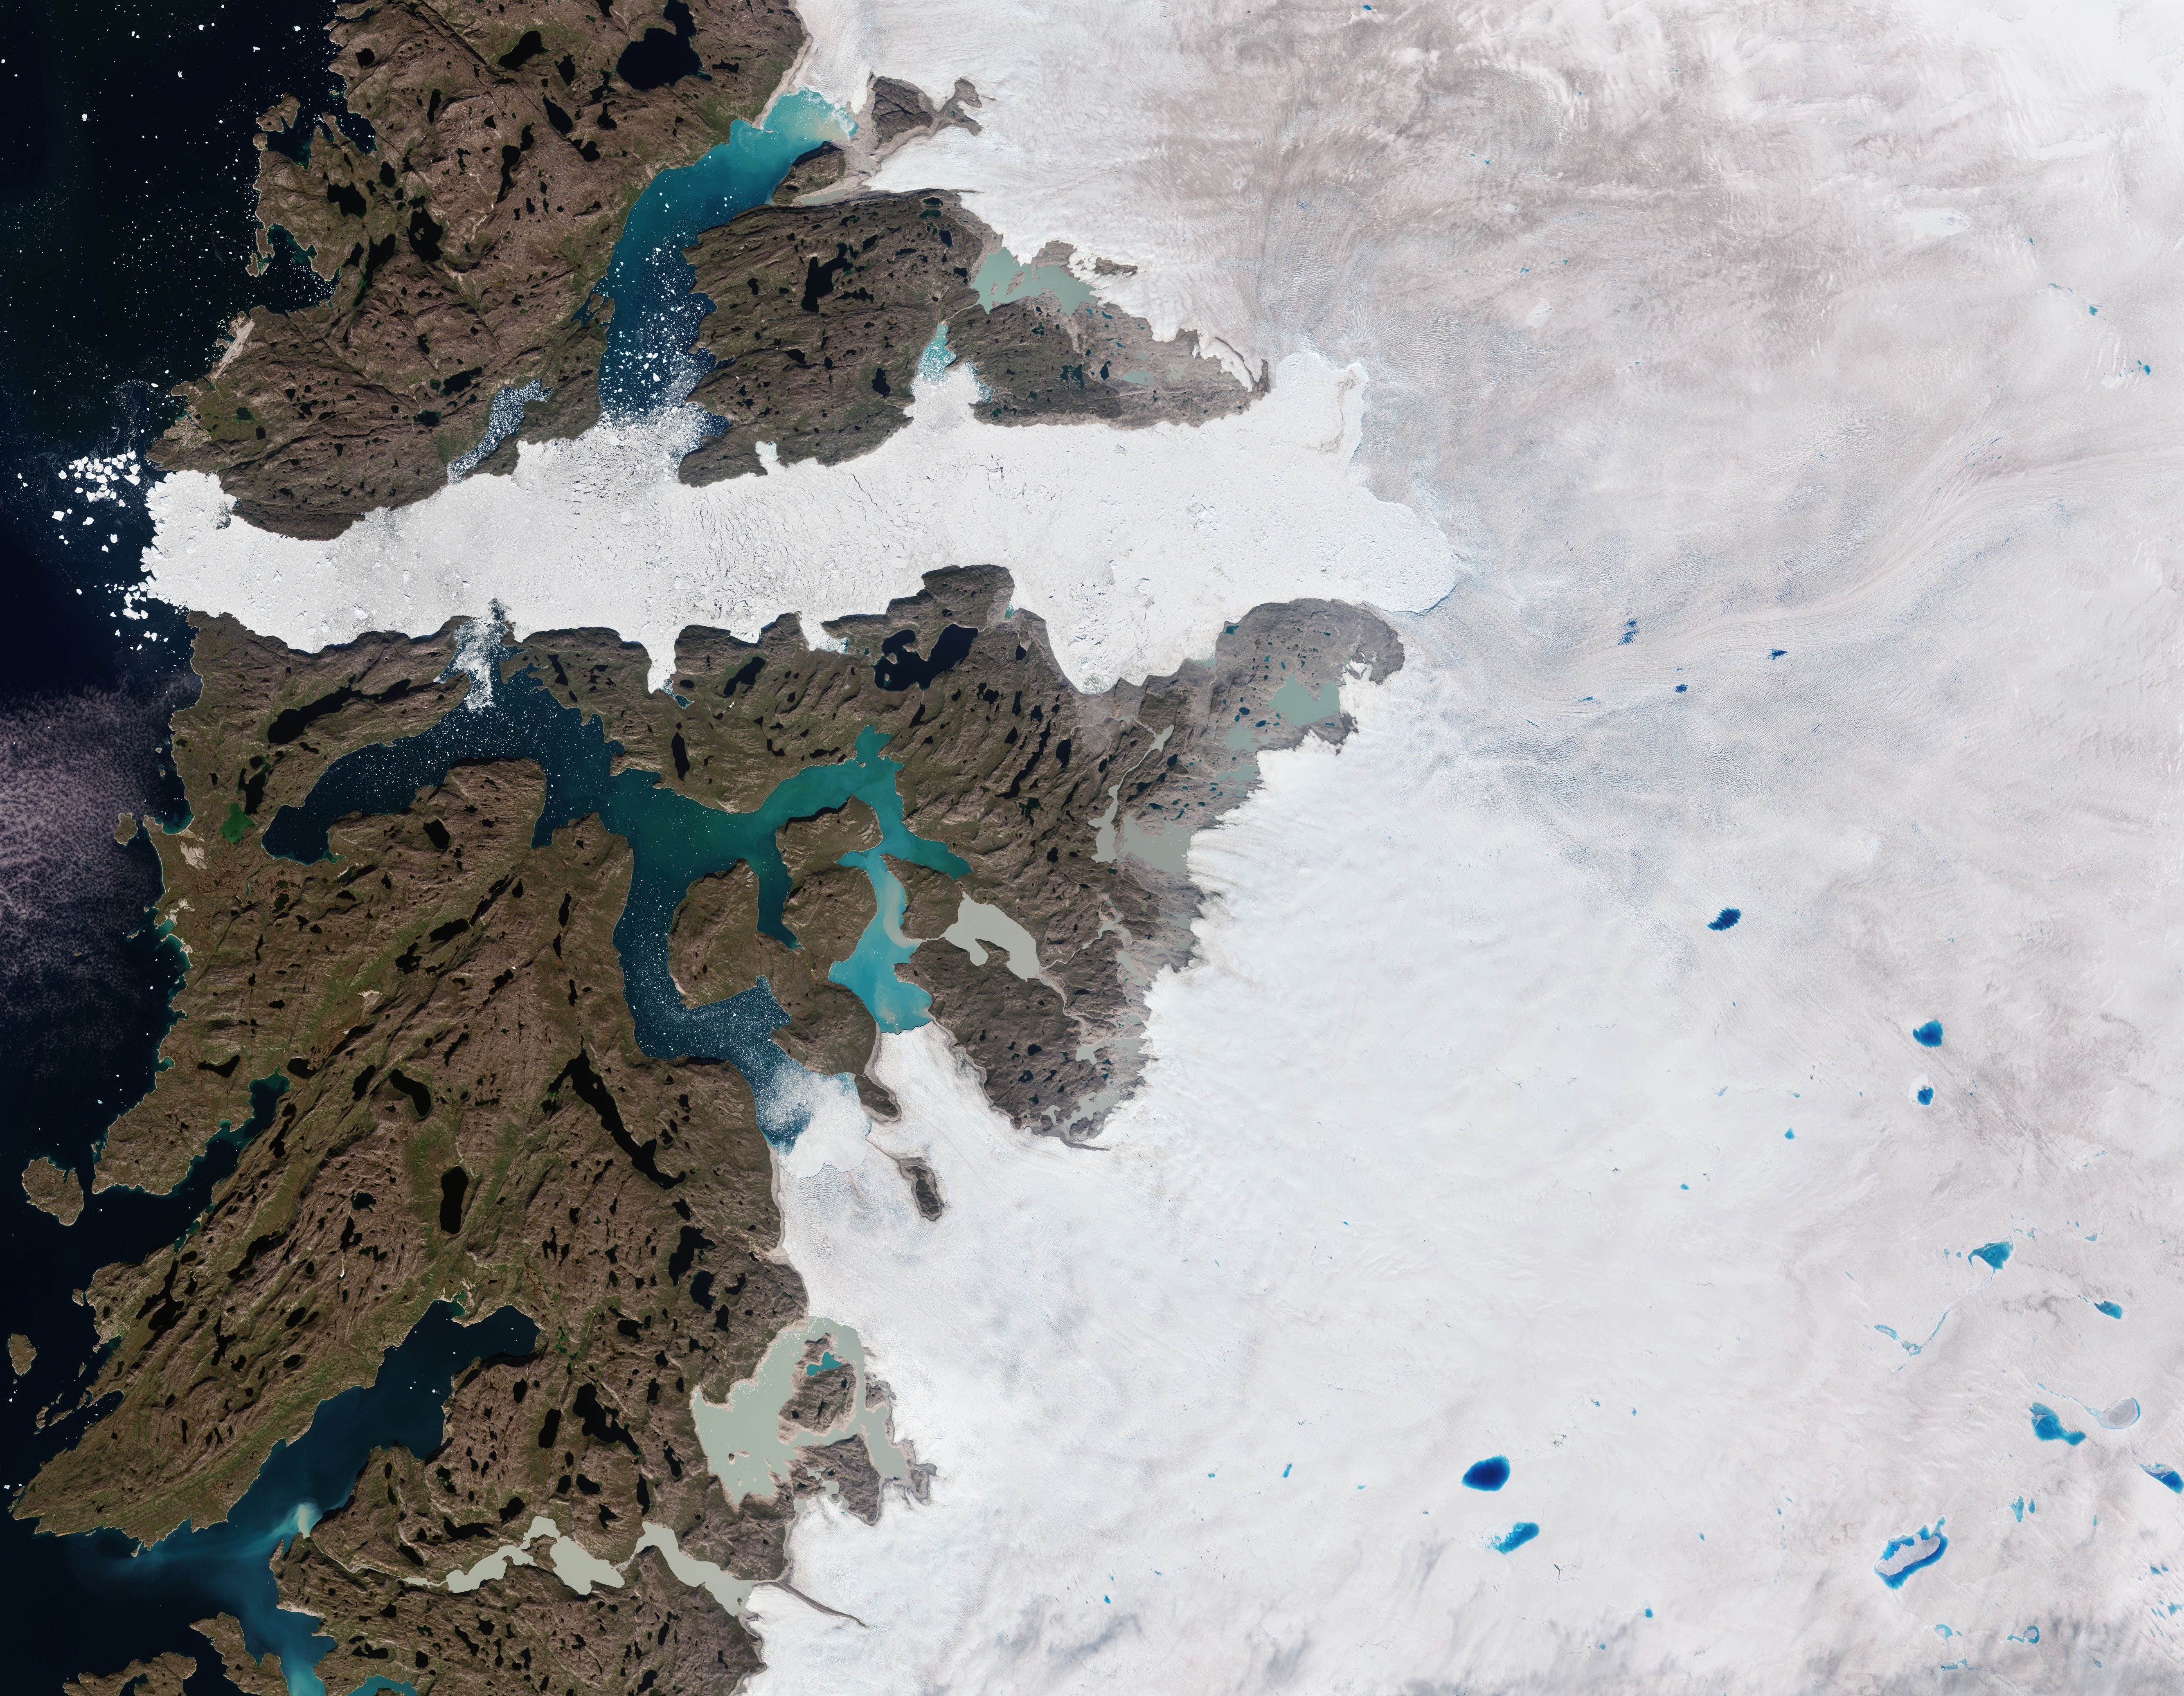
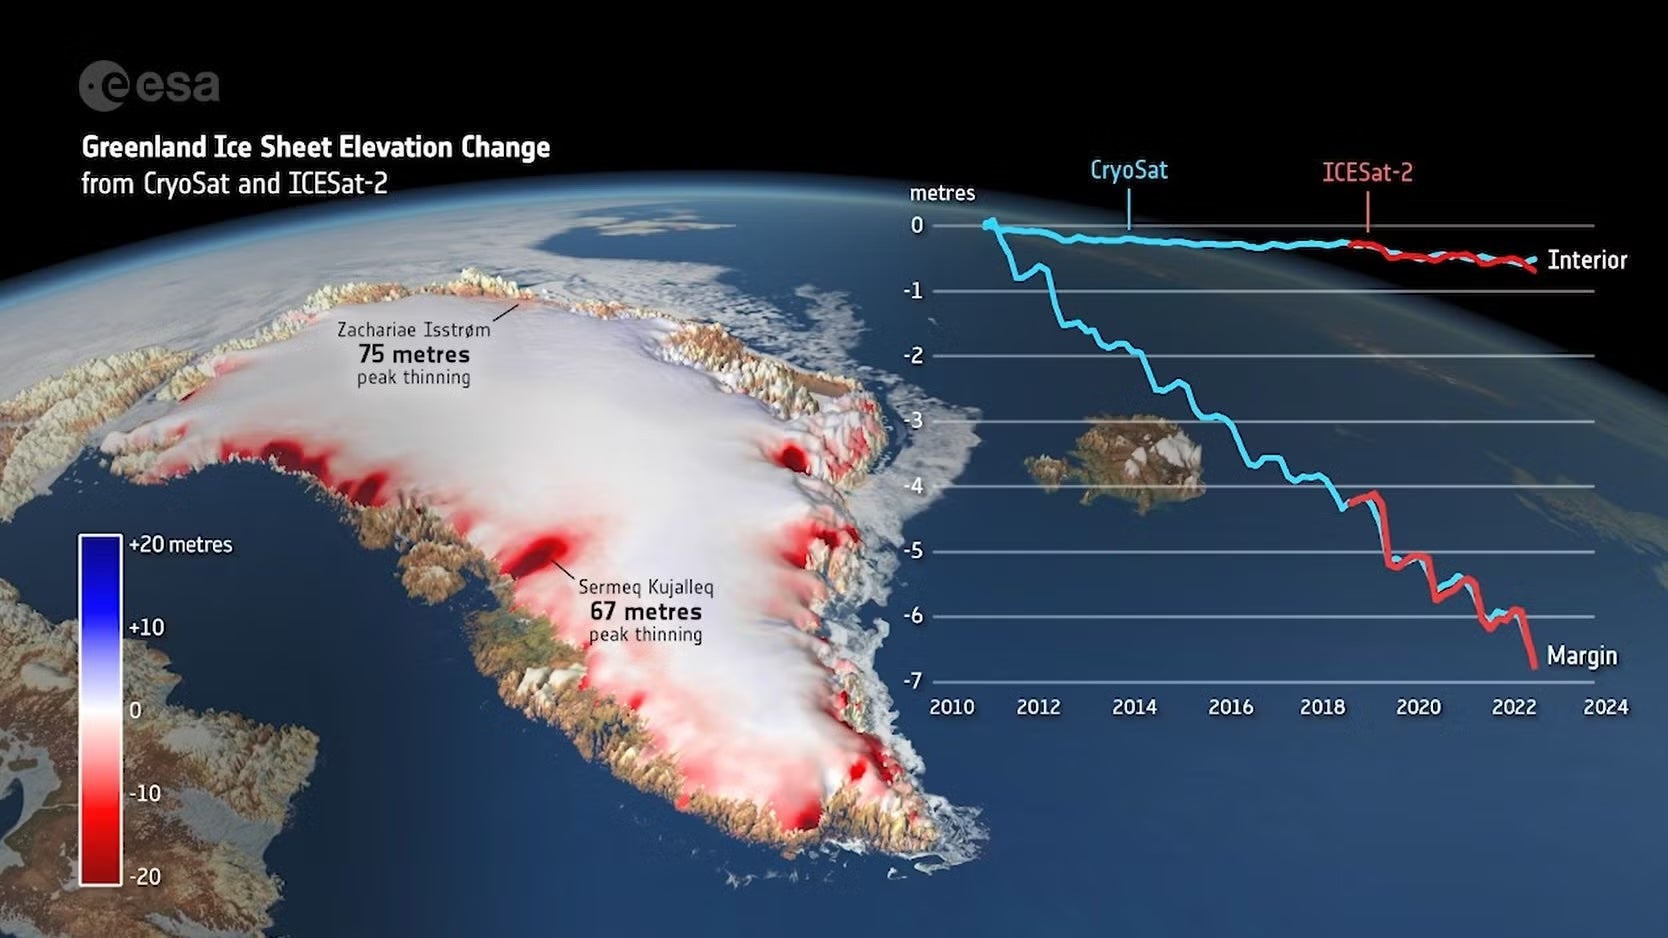
Altogether, the ice sheet shrank by 563 cubic miles, losing enough mass to fill Africa’s Lake Victoria. The most extreme thinning occurred at the glaciers along its edge, including those known as Jakobshavn Isbræ and Zachariae Isstrøm.
Between 2013 and last year, the sheet thinned by a little under four feet on average, although thinning across its ablation zone — the lower part of the glacier where more snow is lost than accumulates — was five times larger than that. The biggest changes occurred during 2012 and 2019, when temperatures were extremely hot.
The measurements were recorded using the agencies’ ice satellite missions: CryoSat-2 and ICESat-2. NASA’s ICESat-2. launched in 2018 and carries an instrument that allows scientists to measure the elevation of ice sheets, glaciers, and sea ice.
CryoSat-2 uses radar to achieve similar results, while ICESat-2 has a laser system. Radar can penetrate the ice sheet’s surface and through clouds. Laser signals cannot operate when clouds are present.
Despite these differences, the scientists were “very excited” to find that the measurements of the Greenland ice sheet’s elevation change largely agreed, with 3 percent of what is actually happening.
That finding was published Friday in the journal Geophysical Research Letters.
“Their complementary nature provides a strong motivation to combine the data sets to produce improved estimates of ice sheet volume and mass changes,” Nitin Ravinder, the study’s lead author and a researcher at the UK Center for Polar Observation and Modeling, said in a release. Based at Northumbria University, the center is a partnership of six universities and the British Antarctic Survey: the UK’s national polar research institute.
“As ice sheet mass loss is a key contributor to global sea level rise, this is incredibly useful for the scientific community and policymakers.”
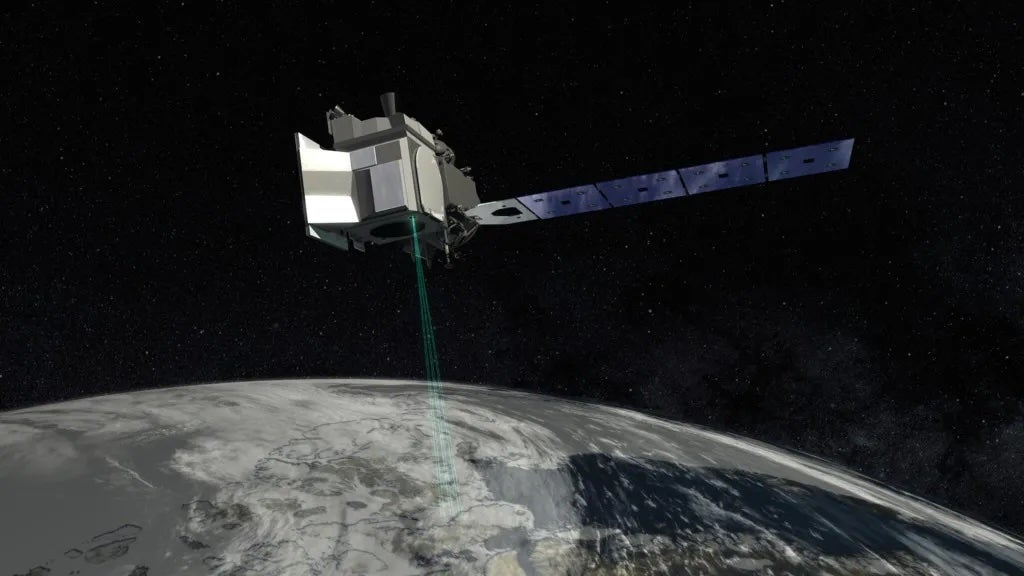
The authors said this confirms that the satellite observations can be combined to produce a more reliable estimate of ice loss than they could alone, and suggests that one could be relied upon if the other were to fail.
And, the need for reliable data is necessary, as the planet continues to warm at an accelerated rate, causing the sheet to melt and flow more rapidly. The freshwater coming from the glacier can slow critical ocean circulation, and the Greenland ice sheet is losing about 270 billion tons of ice mass every year.
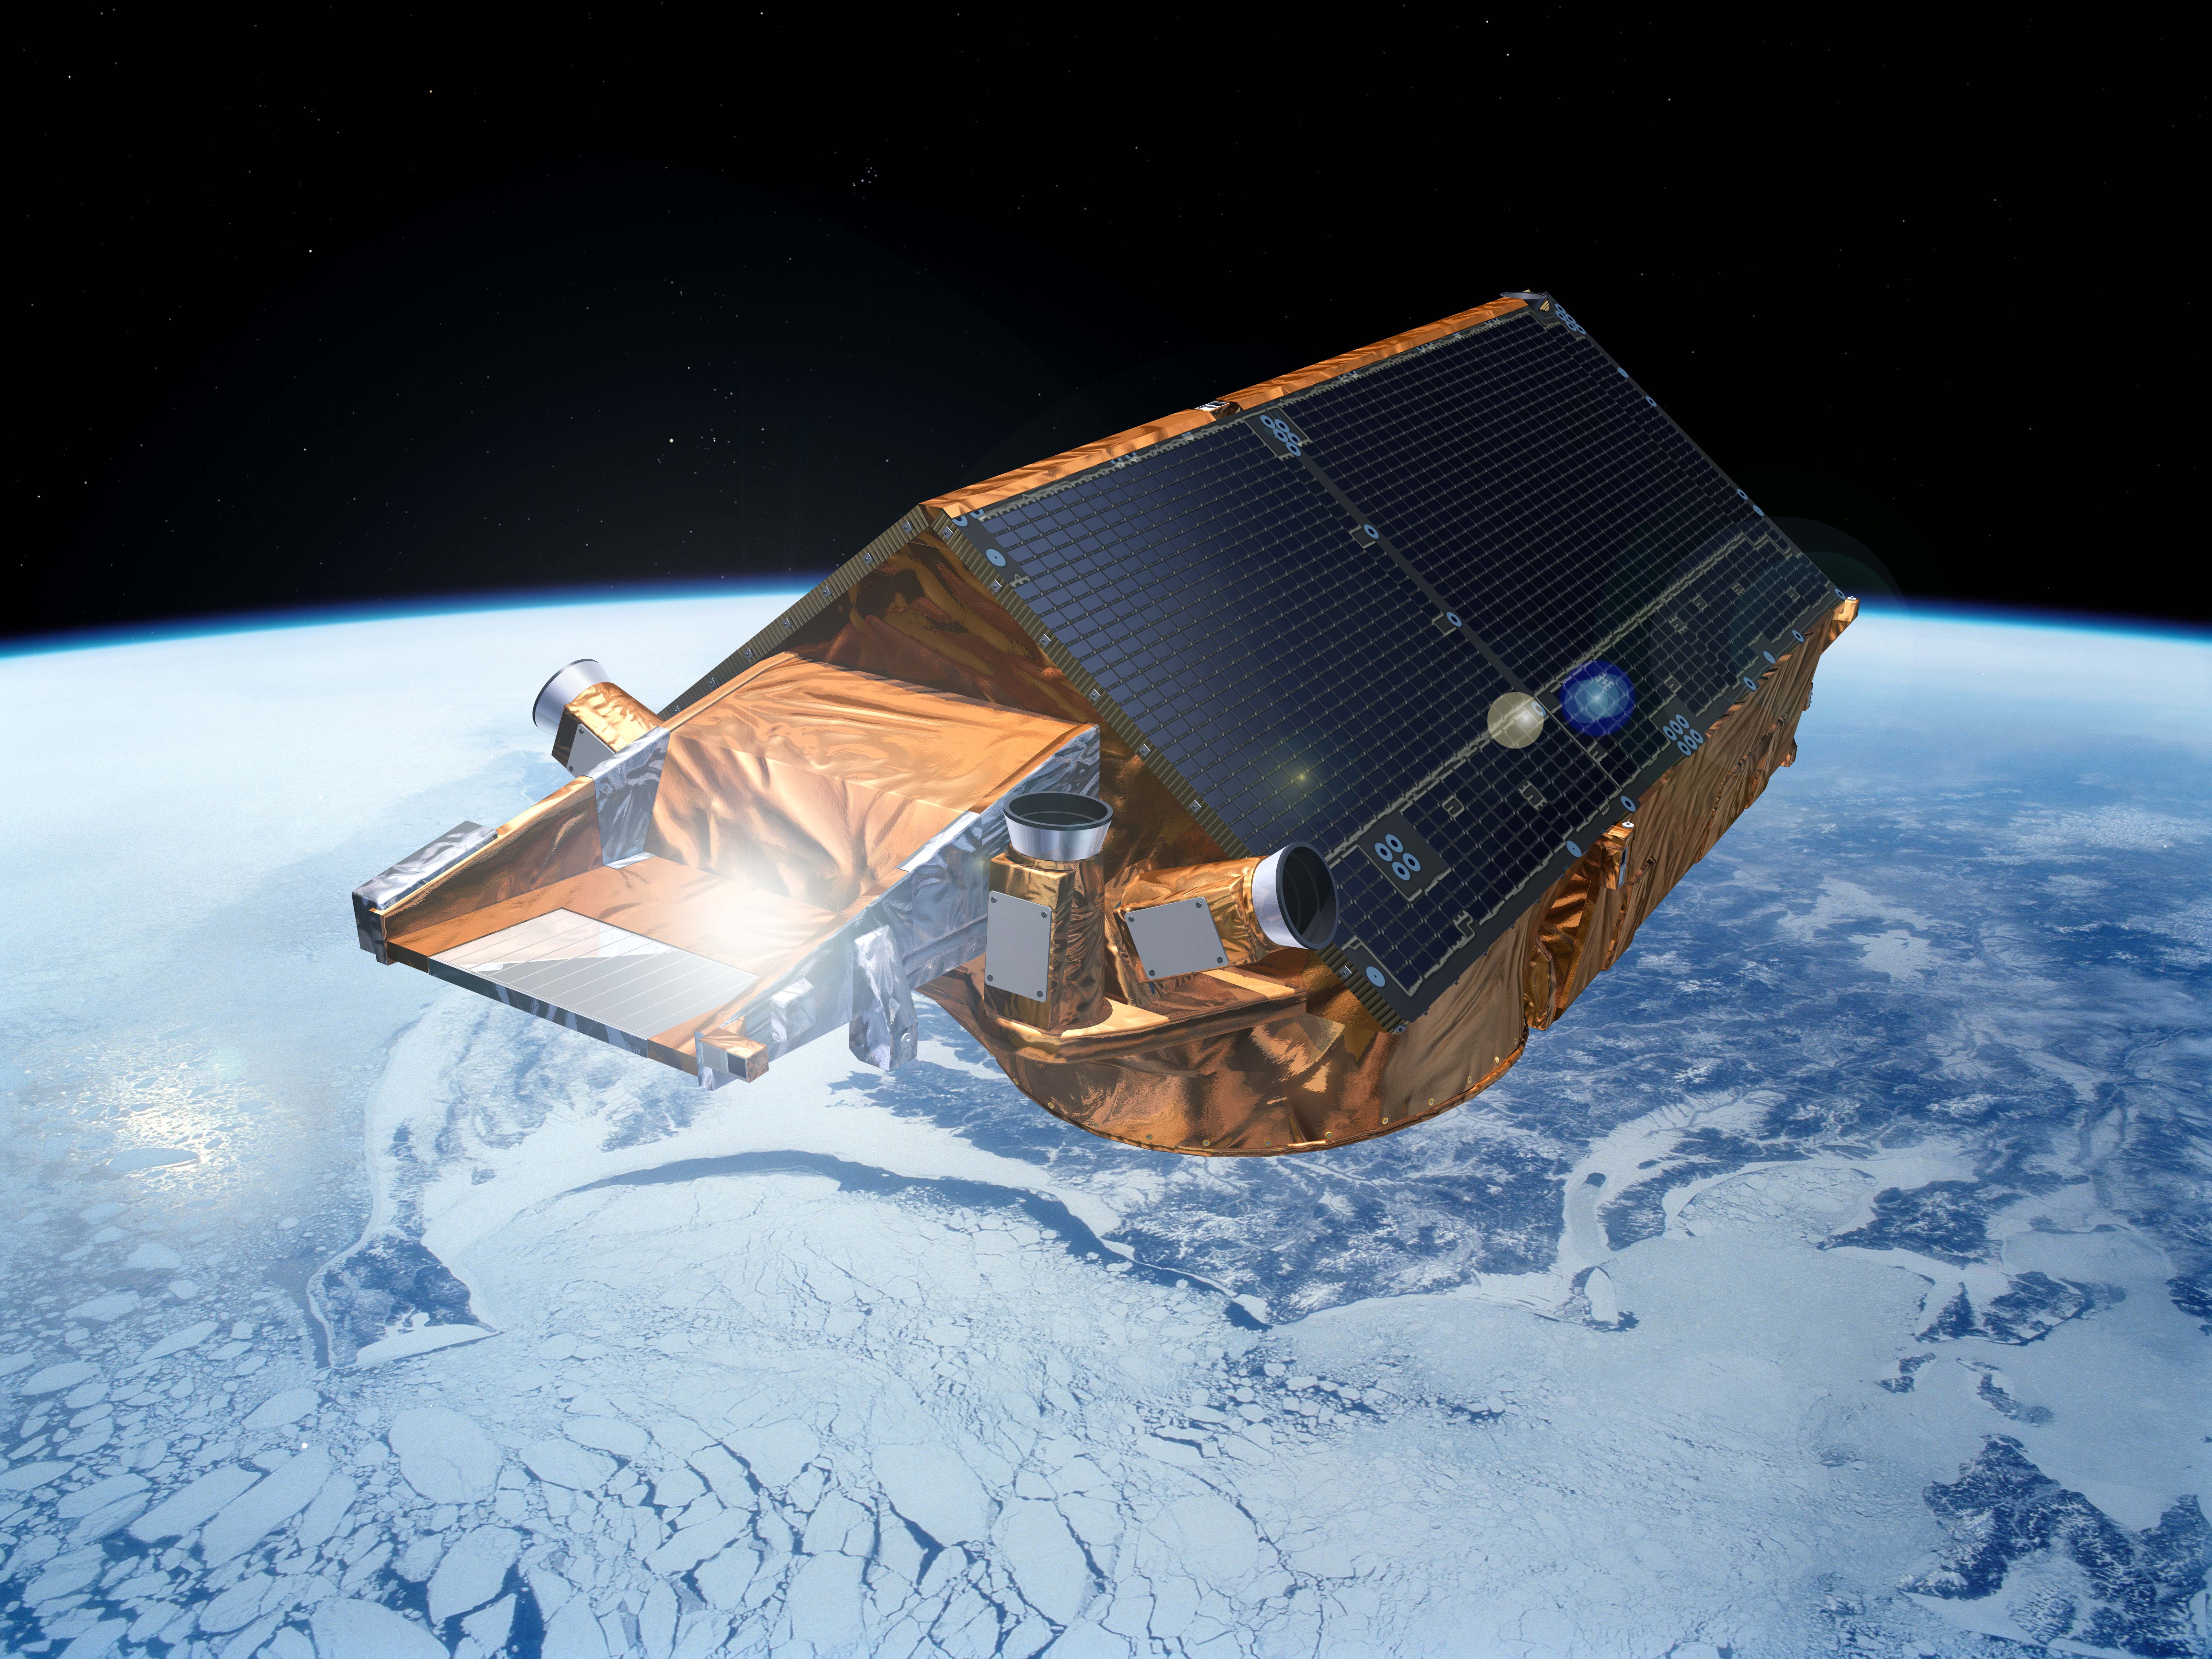
“This collaboration represents an exciting step forward, not just in terms of technology but in how we can better serve scientists and policymakers who rely on our data to understand and mitigate climate impacts,” Tommaso Parrinello, ESA’s CryoSat Mission Manager, said in a statement.

 By The Independent (Science) | Created at 2024-12-20 22:58:53 | Updated at 2024-12-25 20:41:35
4 days ago
