By The Rio Times | Created at 2026-10-09 01:26:47 | Updated at 2026-10-09 02:31:24
1 hour ago
By The Rio Times | Created at 2026-10-09 01:26:47 | Updated at 2026-10-09 02:31:24
1 hour ago

Key Facts
- Soybeans eased 0.72% with the SOYB tracker closing at US$27.39 as Chinese crushers sat on the largest soybean inventories in at least 15 years.
- Corn slipped 0.47% with the CORN proxy settling at US$18.96 while traders compared export offers from Argentina, Brazil and China against U.S. supplies.
- Wheat fell 0.56% as the WEAT tracker ended at US$24.76, pressured by relative calm in the Black Sea despite Russian and Ukrainian export workarounds.
- China demand is cooling because 111 domestic crushing plants held 7.96 million tonnes of soybeans in late September, covering needs through early February.
- Argentina is ramping up with the Buenos Aires Grain Exchange projecting 2026/27 soybean production at 53.6 million tonnes, up from 50.1 million tonnes in the prior cycle.
- Currency is in play as a stronger Brazilian real makes Brazilian-origin grain relatively more expensive and lifts the competitiveness of U.S. export offers.
Today’s Focus
Grain trackers fell across the board on Thursday, October 8, 2026, as traders trimmed risk before the USDA’s monthly WASDE supply-and-demand report and digested evidence that China, the world’s top soybean buyer, is exceptionally well covered.
The soybean tracker SOYB closed down 0.72% at US$27.39, corn proxy CORN lost 0.47% to US$18.96, and wheat fund WEAT eased 0.56% to US$24.76.
China’s crushers held 7.96 million tonnes of soybeans in late September, the most in at least 15 years, enough with Brazilian and Argentine cargoes and state reserves to cover needs through early February.
Argentina’s Buenos Aires Grain Exchange sees 2026/27 soybean output at 53.6 million tonnes, up from 50.1 million tonnes, adding longer-term supply comfort to a market already watching slow U.S. harvest fieldwork.
What matters today. The market is pricing comfortable near-term Chinese demand and rising South American supply prospects ahead of the USDA report.
01 The session in one read
Grain proxies drifted lower in the Thursday, October 8, 2026 session as investors squared their books before the USDA’s monthly supply-and-demand snapshot, known as WASDE, which is due on Friday 9 October and often resets the global balance sheet.
The dominant story was China, where soybean inventories at 111 crushing plants hit 7.96 million tonnes in late September, the highest level in at least 15 years. Crushers have largely covered needs through early February using Brazilian and Argentine cargoes and state reserves, so nearby Chinese buying is unusually quiet.
Assessment — Supply comfort trumps weather and war MEDIUM
Absent a sharp escalation in the Black Sea or a truly damaging US harvest delay, the path of least resistance for grain proxies looks lower, because China is well stocked and Argentina is adding tonnes.
The variable to watch is whether the USDA’s October WASDE, due on Friday 9 October, revises Chinese import demand or South American production enough to shake traders out of that comfort.
Follow this story
Get an email when there’s news on Markets
Free. One email a day at most, and only when there is news. This also signs you up to our weekday newsletter, The LatAm Brief. Nothing arrives until you click the confirmation link, and you can stop either with one click. Privacy policy.
02 The board
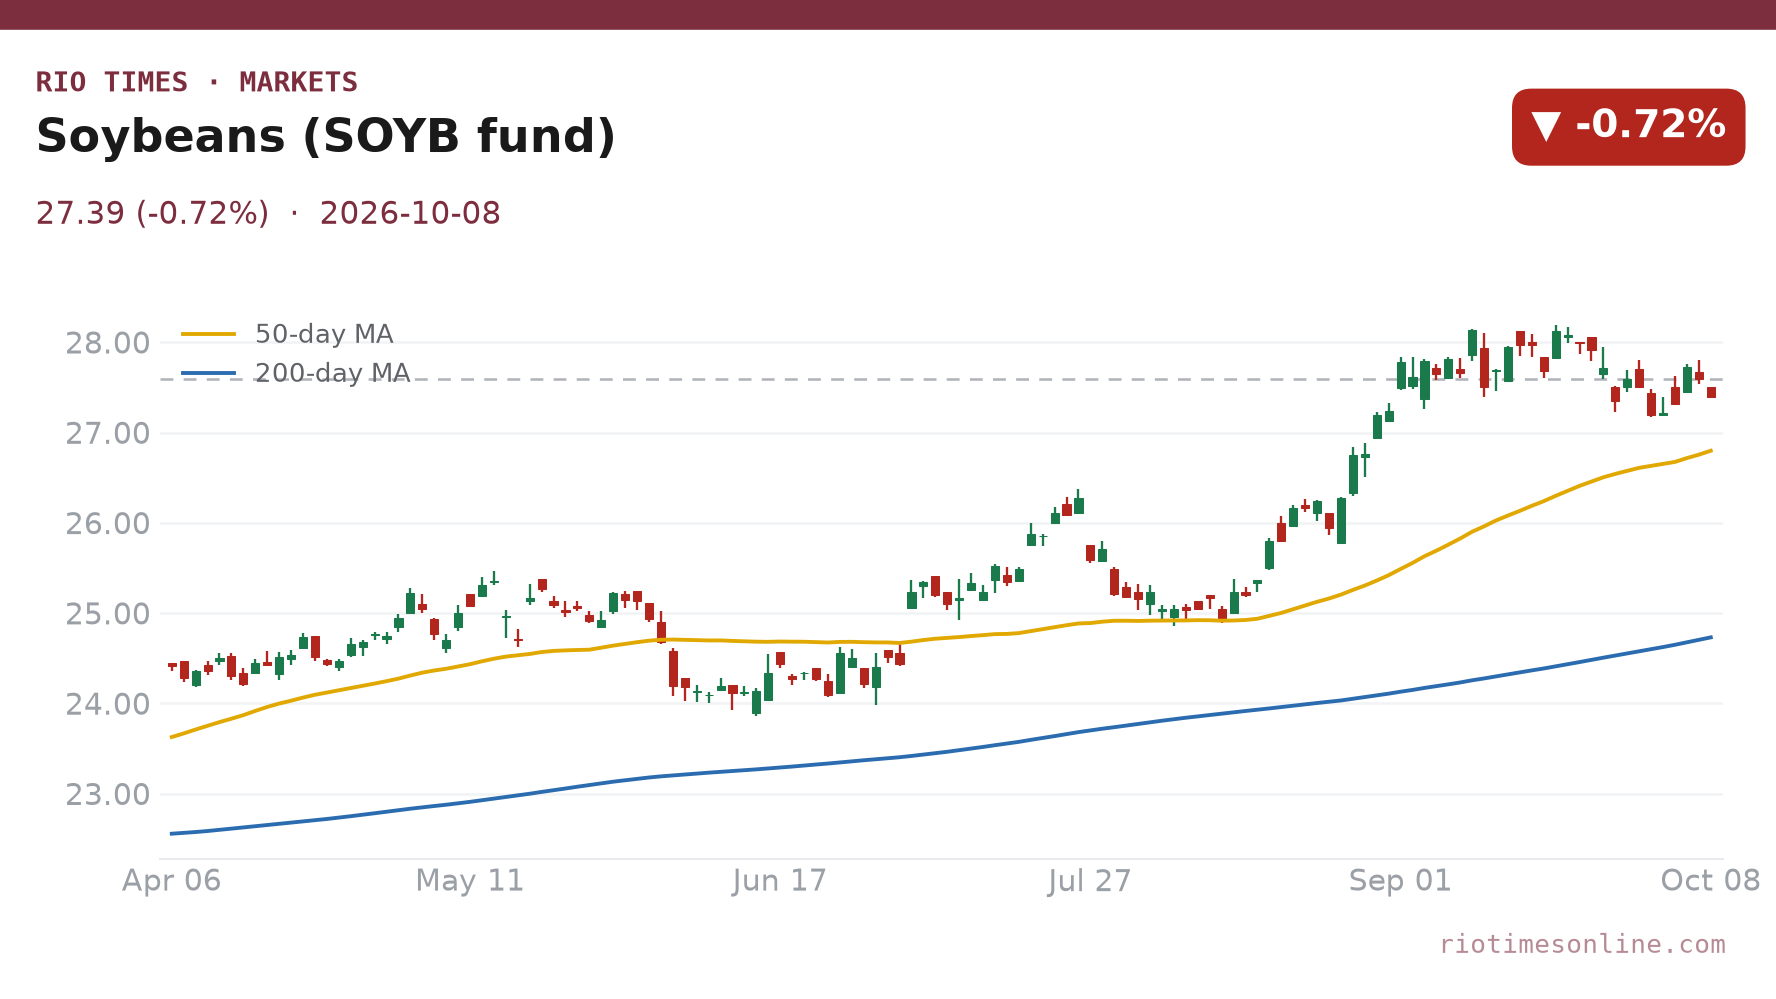
The soybean-tracking fund SOYB fell 0.72% to US$27.39, the weakest of the three main grain proxies. Corn followed suit with CORN losing 0.47% to US$18.96, while wheat fund WEAT slipped 0.56% to US$24.76.
For foreign investors, these exchange-traded trackers convert the underlying Chicago futures moves into a single dollar price, offering a quick read on the soft commodity complex without holding a futures account.
| Soybeans (SOYB) | US$27.39 | -0.72% |
| Corn (CORN) | US$18.96 | -0.47% |
| Wheat (WEAT) | US$24.76 | -0.56% |
Source: RT close, 2026-10-08. Where a commodity has no spot feed, an exchange-traded tracker or leading producer is shown as a labelled proxy.
Live Market IntelligenceThe live market boardInside: market breadth, the sector heatmap, currencies & rates, the Latin America scoreboard and the full instrument board.Rio Times · Live Market Intelligence
Latin America — Cross-Market Board
Regional
Oct 8, 2026 · 21:54
Ibovespa · benchmark
206,220.24 +0.94%
L 167,142day rangeH 168,310
+21.85% over 12 months
Market breadth · 5 names
60% advancing
3 ▲ advancing2 declining ▼
Currencies, rates & key inputs
Latin America scoreboard
IndexLastTodayStrength
IbovespaBrazil 206,220.24 +0.94%
S&P/BMV IPCMexico 64,851.89 +0.31%
S&P IPSAChile 11,024.22 +0.22%
S&P MERVALArgentina 2,832,472 +0.30%
MSCI COLCAPColombia 2,525.90 -0.36%
BVL S&P PerúPeru 60,766.81 -1.71%
Full instrument board
| IBOV | 206,220.24 | +0.94% | +21.85% | 204,302.33 | 168,310 | 167,142 | — |
| IPSA | 11,024.22 | +0.22% | — | 10,999.64 | 11,210 | 10,984 | 1,513,213,483 |
| IPC MEX | 64,851.89 | +0.31% | +12.17% | 64,653.33 | 66,121 | 65,405 | 108,886,187 |
| MERVAL | 2,832,472 | +0.30% | +30.51% | 3,022,485 | 3,042,365 | 2,991,150 | — |
| COLCAP | 2,525.90 | -0.36% | — | 9.04 | 9.05 | 9.02 | 4,133 |
| BVL PERÚ | 60,766.81 | -1.71% | — | — | — | — | — |
| USD/BRL | 5.16 | +0.01% | -5.13% | 5.16 | 5.18 | 5.14 | — |
| EUR/BRL | 5.95 | +1.01% | -5.83% | 5.89 | 5.98 | 5.94 | — |
| USD/MXN | 17.06 | -0.24% | -8.58% | 17.10 | 17.08 | 17.01 | — |
| USD/CLP | 913.98 | +0.04% | -5.67% | 913.65 | 915.11 | 906.68 | — |
| USD/COP | 3,140 | +0.03% | -22.04% | 3,139 | 3,141 | 3,105 | — |
| USD/PEN | 3.36 | -0.66% | -4.82% | 3.38 | 3.38 | 3.35 | — |
| USD/ARS | 1,493 | +0.10% | +12.96% | 1,491 | 1,494 | 1,480 | — |
| USD/UYU | 40.27 | +1.24% | +1.80% | 39.77 | 40.27 | 40.23 | — |
| USD/PYG | 5,939 | +1.68% | -19.54% | 5,841 | 5,939 | 5,925 | — |
| USD/BOB | 11.64 | -0.76% | +72.04% | 11.73 | 11.72 | 11.64 | — |
| USD/DOP | 58.34 | +1.25% | -3.44% | 57.62 | 58.34 | 58.04 | — |
| USD/CRC | 445.92 | +0.89% | -9.71% | 441.97 | 448.50 | 445.92 | — |
Largest moves today
BVL PERÚ 60,766.81 -1.71%
USD/PYG 5,939 +1.68%
USD/DOP 58.34 +1.25%
USD/UYU 40.27 +1.24%
EUR/BRL 5.95 +1.01%
IBOV 206,220.24 +0.94%
USD/CRC 445.92 +0.89%
USD/BOB 11.64 -0.76%
The session read
The Ibovespa rose 0.94%, with breadth positive — 3 of 5 names higher. IPC MEX led, while BVL PERÚ lagged.
03 What moved it
Chinese demand, or the lack of fresh demand, was the clearest bearish signal. Because the world’s leading soybean importer has enough supply locked in through the first week of February, nearby purchases have slowed and the futures curve is feeling it.
Argentina added future supply to the picture. The Buenos Aires Grain Exchange projected 2026/27 soybean production at 53.6 million tonnes, up from 50.1 million tonnes in 2025/26, making South America’s export engine look even more powerful.
Black Sea wheat was a secondary factor. Relative calm in the war-traded region pushed wheat lower even though Russia and Ukraine continue to seek export workarounds, capping the risk premium that had briefly supported wheat prices.
04 The Latin American read
Brazil and Argentina are the world’s export engine for grains, so changes in the US dollar versus the Brazilian real matter. A stronger real makes Brazilian-origin corn and soybeans relatively more expensive in global terms, which improves the competitiveness of U.S. offers.
Argentina’s projected 53.6 million tonne soybean crop reinforces the region’s role as the supplier that matters most after Chinese buying lulls. U.S. soybean and corn harvesting is running behind its five-year average, but Latin American production is expected to fill any gaps.
05 The names to watch
SOYB, the soybean tracker, is the cleanest way to monitor whether Chinese demand returns before February. CORN is the proxy for global feed and export competition, with traders comparing Argentine, Brazilian and Chinese offers against U.S. supplies.
WEAT remains the instrument for Black Sea risk. Russia and Ukraine are both working on alternative export routes, and any escalation or closure would be felt most quickly in wheat prices.
06 The outlook
The next major catalyst is the USDA WASDE report. Ahead of it, corn, soybean and wheat prices are likely to stay defensive unless there is a fresh Black Sea disruption or a serious deterioration in U.S. harvest progress.
07 What to watch
- USDA WASDE: The monthly supply-and-demand report could reset Chinese import demand or South American production estimates.
- Black Sea exports: Any escalation in Russia or Ukraine would tighten wheat availability and lift WEAT.
- Brazilian real: A further real appreciation would make Brazilian grain less competitive and support U.S. export demand.
- U.S. harvest pace: Delayed soybean and corn fieldwork behind the five-year average could trim yields if bad weather persists.
Frequently Asked Questions
Why did grains fall on Thursday?
Comfortable Chinese soybean stocks, strong Argentine production forecasts and pre-USDA positioning pulled SOYB, CORN and WEAT lower.
What is SOYB?
SOYB is an exchange-traded fund that tracks soybean prices, closing at US$27.39 after a 0.72% decline.
Why is China so important for soybeans?
China is the world’s largest soybean importer, and its 111 leading crushing plants are holding the largest inventories in at least 15 years.
How does the Brazilian real affect grains?
A stronger real makes Brazilian grain more expensive in dollars, shifting export competitiveness toward U.S. suppliers.
Market data: RT
This article was produced by The Rio Times’ automated newsroom system. How we use AI · Report an error · Editorial responsibility: Matthias Camenzind, Editor-in-Chief
LatAm Markets: Live Signals → — real-time movers, turnover leaders and FX across Latin America.