By Finbold | Created at 2026-08-17 12:42:05 | Updated at 2026-08-17 13:04:55
1 hour ago
By Finbold | Created at 2026-08-17 12:42:05 | Updated at 2026-08-17 13:04:55
1 hour ago
Dogecoin (DOGE) may be approaching a major breakout, according to cryptocurrency analyst Ali Martinez, who highlighted a rare combination of bullish technical signals.
In an X post on August 15, Martinez pointed to the Tom DeMark (TD) Sequential indicator, which flashed a buy signal on Dogecoin’s monthly chart.
The signal appeared after DOGE formed an inverted hammer candle and is now developing a doji, a setup that closely resembles the market structure seen in August 2022.
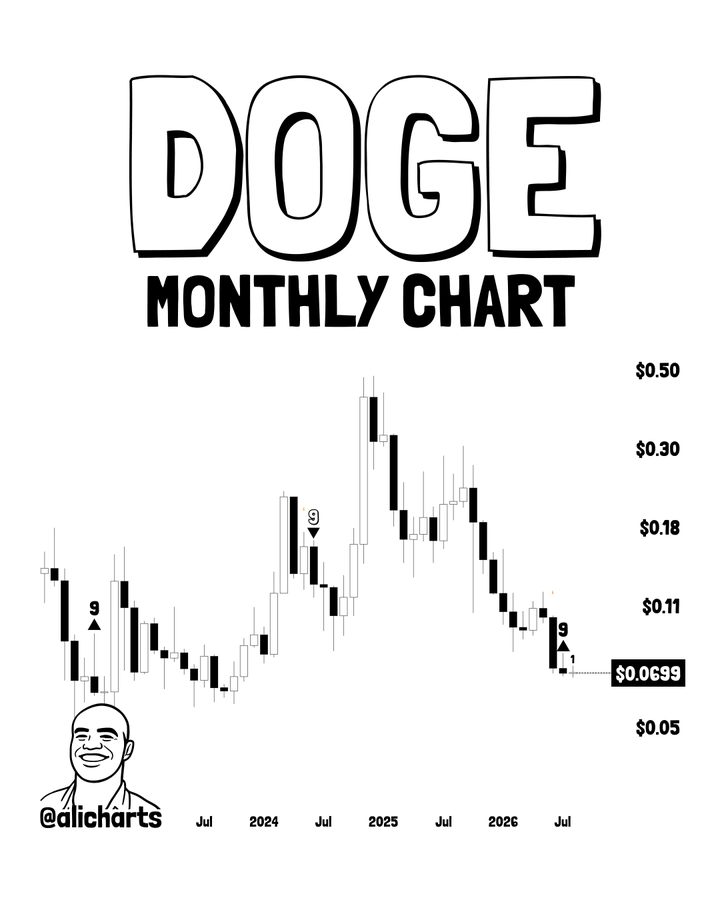 Dogecoin Tom DeMark (TD) Sequential indicator. Source: Ali Martinez
That earlier pattern marked a major turning point for Dogecoin. Following the inverted hammer, TD buy signal, and doji combination, DOGE rallied approximately 145% in the following month.
The current setup suggests a similar trend reversal could be developing after a prolonged decline from its 2025 highs.
Whales accumulating Dogecoin
At the same time, the technical outlook is being reinforced by growing accumulation among large holders.
According to on-chain data from Santiment, Dogecoin whales added more than 430 million DOGE over the past week. Whale holdings increased from roughly 18.47 billion DOGE to nearly 18.85 billion DOGE during the period, indicating that large investors may be positioning for a potential upside move.
3/5 Whales appear to be positioning for upside.
Over the past week, large holders have accumulated more than 430 million DOGE, adding conviction to the bullish technical setup. pic.twitter.com/U3vJpJdvGb
Historically, sustained whale accumulation during periods of price weakness has often preceded significant rallies as large holders absorb available supply ahead of broader market advances.
Meanwhile, Glassnode’s UTXO Realized Price Distribution (URPD) data highlights a critical resistance zone at $0.0813.
More than 30 billion DOGE were previously transacted around this level, making it one of the most significant supply clusters on the chart. A decisive monthly close above $0.0813 would indicate that buyers have absorbed a major concentration of selling pressure.
If that breakout occurs, the next significant resistance level sits near $0.1774. The URPD chart shows another large concentration of historical transactions in this region, making it a logical upside target for any sustained rally.
DOGE price analysis
At press time, the meme cryptocurrency was trading at $0.07, up about 0.6% over the past 24 hours. On the weekly timeframe, DOGE had also gained roughly 0.6%.
From a technical perspective, Dogecoin is trading slightly below its 50-day simple moving average (SMA) of $0.07187 and well below its 200-day SMA of $0.09014. This suggests short-term momentum is stabilizing, although the broader trend remains bearish.
Meanwhile, the 14-day Relative Strength Index (RSI) stands at 44.13, indicating neutral momentum with a slight bearish bias.
While DOGE is not oversold, buyers will need to push the price above the 50-day SMA to strengthen the recovery case, while a move above the 200-day SMA would be needed to confirm a longer-term trend reversal.
Featured image from Shutterstock