By CryptoSlate | Created at 2026-08-16 14:58:12 | Updated at 2026-08-16 15:08:41
1 hour ago
By CryptoSlate | Created at 2026-08-16 14:58:12 | Updated at 2026-08-16 15:08:41
1 hour ago
Bitcoin's calm near $62,941 masks a split in Bitcoin futures positioning: either a downside break or an upside breakout could gain speed from forced trades.
At 09:30 UTC on Aug. 15, CoinGlass showed $47.88 billion of Bitcoin open interest, $38.49 billion of 24-hour futures volume and $2.234 billion of spot volume. Futures turnover was 17.23 times CoinGlass's spot-volume measure during the same rolling window.
The ratio measures relative trading activity. Open interest measures contracts that remain outstanding, and every contract has a long and a short. The aggregate therefore leaves direction unresolved.
The directional evidence splits across markets. Small positive funding on offshore perpetuals exposes longs if price falls, while a large net-short position among CME leveraged funds creates covering demand if price rises. The first side forced to retreat will depend on which range boundary attracts enough cash-market demand or supply to keep Bitcoin moving.
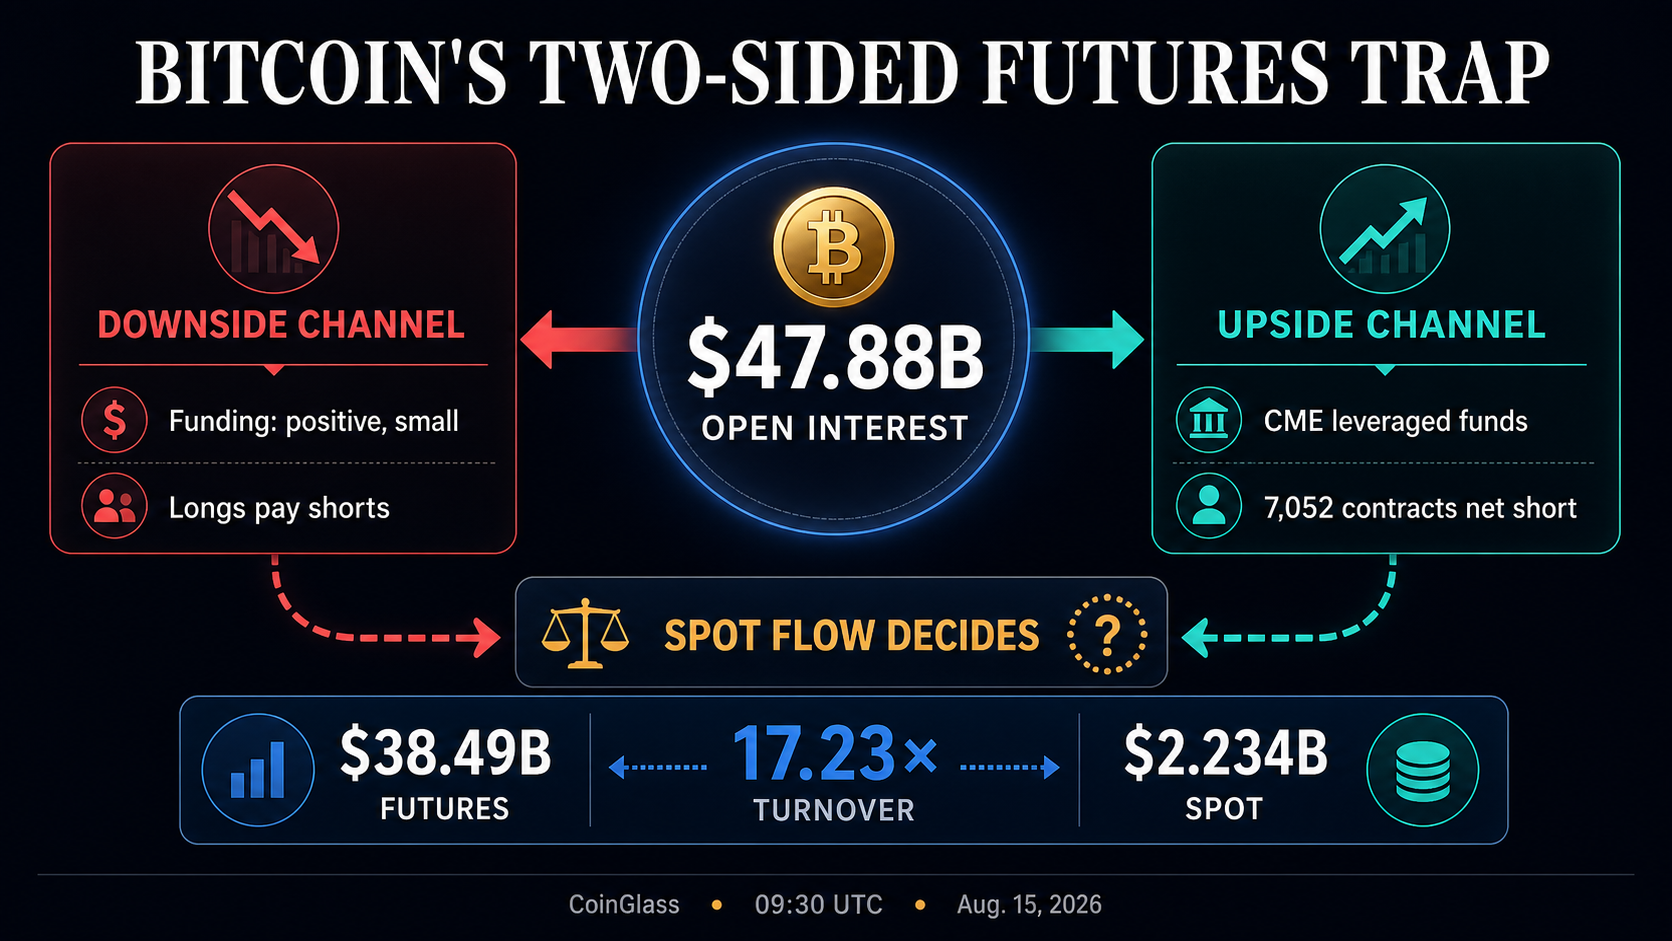
Bitcoin futures positioning points in opposite directions
| CoinGlass activity | $47.88B open interest; futures volume 17.23 times its spot measure | A sustained range break can transmit through a large derivatives market |
| Offshore funding | Positive but small on OKX and Deribit | Falling prices can prompt leveraged longs to close |
| CME positioning | Leveraged funds net short 7,052 outright standard contracts | Rising prices can prompt short covering |
| US spot ETF flows | -$385.2M from Aug. 10-14; +$480.1M from Aug. 3-14 | Recent demand weakened within a still-positive wider August window |
Funding supplies the clearest downside channel. OKX showed a current-period BTC-USDT perpetual rate of about 0.00752%, and Deribit showed a smaller positive eight-hour rate in the retained snapshot. Positive rates mean longs paid shorts on those instruments.
A price decline accompanied by closing positions could turn those longs into additional sellers. Falling open interest and a funding reset during such a move would strengthen the evidence that deleveraging was underway.
The rates were small, venue-specific observations. They show a pathway for a long unwind while leaving the scale of market-wide long crowding uncertain.
CME positioning creates the opposite pathway. CFTC data for Aug. 11 classified leveraged funds with 4,997 outright long and 12,049 outright short standard CME Bitcoin futures contracts. The resulting net short was 7,052 contracts, equivalent to 35,260 BTC of contract face value, alongside 1,958 spread positions. Asset managers held a net 2,234 outright long contracts alongside 157 spreads.
If Bitcoin rises out of its range, leveraged funds reducing short exposure would add futures buying to the move. The weekly figures reflect CME positions at Tuesday's close and lag the live market by four days. The classification also includes strategies such as basis trades and hedges, leaving the intent and liquidation price of individual positions unknown.
Taken together, the offshore and CME snapshots show how Bitcoin futures positioning leaves different groups vulnerable. Offshore funding points to a contingent long-unwind channel, and CME positioning points to a contingent short-covering channel.
Spot demand will decide the first casualty
US spot Bitcoin ETF flows show why the trigger remains unsettled. Farside Investors recorded a combined $385.2 million of net outflows from Aug. 10 through Aug. 14, marking a reversal in recent net demand.
The broader August window still carried a surplus. Flows from Aug. 3 through Aug. 14 remained $480.1 million net positive after strong inflows earlier in the month. Recent ETF demand weakened while the wider period retained a positive balance.
A downside cascade would become more plausible if renewed selling pushes Bitcoin through the range as positive funding persists and open interest contracts. An upside squeeze would gain evidence if cash-market or ETF demand returns while futures shorts cover. Price, spot activity and changes in open interest need to move together before either mechanism becomes the dominant explanation.
Liquidation maps can show where forced activity may accelerate, although CoinGlass's methodology calculates those zones from market data and leverage assumptions. They represent conditional estimates rather than queued orders.
This leaves the answer deliberately two-sided. Bitcoin has enough outstanding derivatives exposure for a range break to feed on position closures, yet the retained evidence does not locate a guaranteed cascade threshold within 1% or 2% of spot. A move of that size would accelerate only if it crossed concentrated margin levels and drew follow-through from the cash market. Until those conditions appear, Bitcoin futures positioning remains two-sided, with both longs and shorts candidates for the first forced exit.
1H +0.08% 24H +0.01% 7D -3.34%
30D +0.02% 60D -3.43% 90D -18.07%
Bitcoin is +0.01% over the past 24 hours and currently sits at rank #1 by market cap.
Market cap $1.26T
Volume (24h) $8.35B -42.91%
Circ. supply 20.07M
FDV $1.32T
Global market cap $2.17T
24H market volume $26.39B
Bitcoin dominance 58.37%