By Finbold | Created at 2026-09-29 13:01:17 | Updated at 2026-09-29 14:30:14
3 hours ago
By Finbold | Created at 2026-09-29 13:01:17 | Updated at 2026-09-29 14:30:14
3 hours ago
Bitcoin (BTC) could reach $220,000 by November 2027 if the cryptocurrency continues following a historical bull cycle pattern that has emerged after every major market bottom, according to a new technical analysis.
The forecast, shared by TradingShot in a TradingView post on September 28, is based on Bitcoin’s recurring “Introduction Channel to Bull Cycle” structure, a pattern that has historically formed after bear market lows before transitioning into a parabolic rally phase.
The analyst argued that Bitcoin is currently in the early stages of forming the same setup that preceded previous cycle advances.
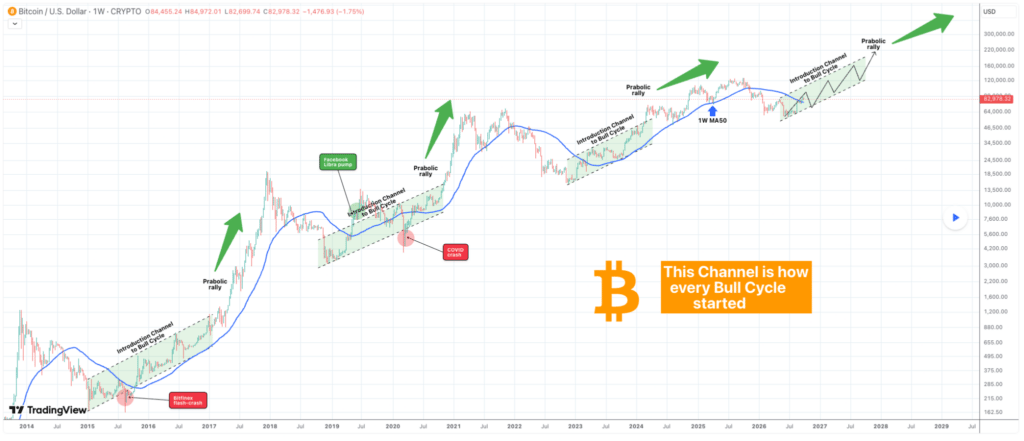 Bitcoin price analysis chart. Source: TradingView
The analysis highlighted a long-term weekly chart showing Bitcoin repeatedly forming an upward-sloping channel after bear market bottoms.
In previous cycles, the pattern began once Bitcoin reclaimed its 50-week moving average and established it as support.
According to the outlook, pullbacks to the 50-week moving average (MA) have historically offered favorable entry points before the next rally.
TradingShot noted that the pattern only failed during major market shocks, including the 2015 Bitfinex flash crash, the 2020 COVID selloff, and the 2019 Facebook Libra-driven volatility.
The current cycle began in 2023 and is developing similarly to previous bull markets. Based on the chart’s projected path, Bitcoin could reach $220,000 by November 2027, with the potential to surpass $300,000 if the cycle evolves into a full parabolic rally.
Bitcoin’s path to $100,000
The bullish long-term outlook comes as Bitcoin appears to be retesting a major breakout zone on shorter timeframes.
Meanwhile, a separate daily analysis by Ali Martinez, shared in an X post on September 28, shows Bitcoin breaking above a double-bottom formation and moving back toward the $82,000 neckline.
BITCOIN: BULLISH RETEST!?$BTC appears to have broken out of a double bottom pattern and is now moving back toward the $82,000 neckline.
If this level holds as support, the retest could offer a buying opportunity before the rally resumes toward the pattern’s $100,000 target. https://t.co/YA0DGPjiYk pic.twitter.com/SXE7VeA9SN
Notably, successful retests of breakout levels confirm that former resistance has turned into support.
If Bitcoin maintains support above the neckline, Martinez projected a potential move toward the $100,000 region in the medium term.
The setup aligns with broader market indicators that continue to support the bullish trend.
At the current price of $84,196, Bitcoin is trading above both its 50-day simple moving average of $76,492 and its 200-day simple moving average of $71,169.
Meanwhile, the asset’s 14-day Relative Strength Index (RSI) stands at 61.08, indicating positive momentum without reaching overbought conditions.
At the same time, the Crypto Fear & Greed Index registered 73, signaling strong investor confidence, while overall market sentiment remained neutral.
Featured image via Shutterstock