By Finbold | Created at 2026-09-13 13:47:14 | Updated at 2026-10-05 17:13:53
3 weeks ago
By Finbold | Created at 2026-09-13 13:47:14 | Updated at 2026-10-05 17:13:53
3 weeks ago
A cryptocurrency trading expert has identified a key XRP support level to watch as the asset continues to hold above $1.35 amid its recent rally.
After falling about 20% from $1.70 to $1.35, market analyst Ali Martinez has identified $1.35 as the most important level for traders to monitor as XRP attempts to stabilize following its recent pullback.
According to on-chain data shared by Martinez in an X post on September 12, XRP has found critical support around $1.35, where approximately 2.29 billion tokens previously changed hands.
The analyst noted that the level remains decisive for the asset’s near-term direction following a period of heavy profit-taking and weakening network participation.
The correction has coincided with whale selling activity. Data from Santiment shows large holders sold or redistributed roughly 90 million XRP over the past week, contributing to downward pressure on the cryptocurrency.
2/5 Over the past three weeks, $XRP has corrected 20%, falling from $1.70 to $1.35.
The pullback appears to be driven in part by profit-taking, with whales selling or redistributing roughly 90 million XRP over the past week. pic.twitter.com/fNMAtMLQxg
At the same time, XRP network activity has slowed sharply. Daily active addresses declined by more than 90%, dropping from 388,492 to 38,163, signaling a significant reduction in user participation during the recent correction.
Meanwhile, Martinez’s URPD (UTXO Realized Price Distribution) data highlights $1.35 as one of the largest concentration zones of XRP holdings. Such areas often act as major support because many investors acquired tokens near those prices and may defend their positions during declines.
If XRP manages to hold above $1.35 and reclaim the $1.38 level, Martinez believes the next upside targets could emerge at $1.60 and $1.68.
Notably, nearly 2 billion XRP previously traded around each of those price zones, making them important resistance levels.
XRP price analysis
Overall, market data from recent sessions suggests traders are already focusing on the $1.35-$1.38 range. Several analysts have identified the area as a key demand zone following XRP’s retreat from its August highs.
A sustained move above $1.38 could strengthen the case for a recovery toward higher resistance levels, while a breakdown below support may expose the token to deeper losses.
Despite the recent correction, XRP continues to trade above several long-term moving averages, suggesting that the broader trend remains intact. The cryptocurrency has been consolidating near the $1.38 region after its August rally, with traders watching for signs of renewed buying momentum.
By press time, XRP was trading at $1.37, down almost 5% over the past week.
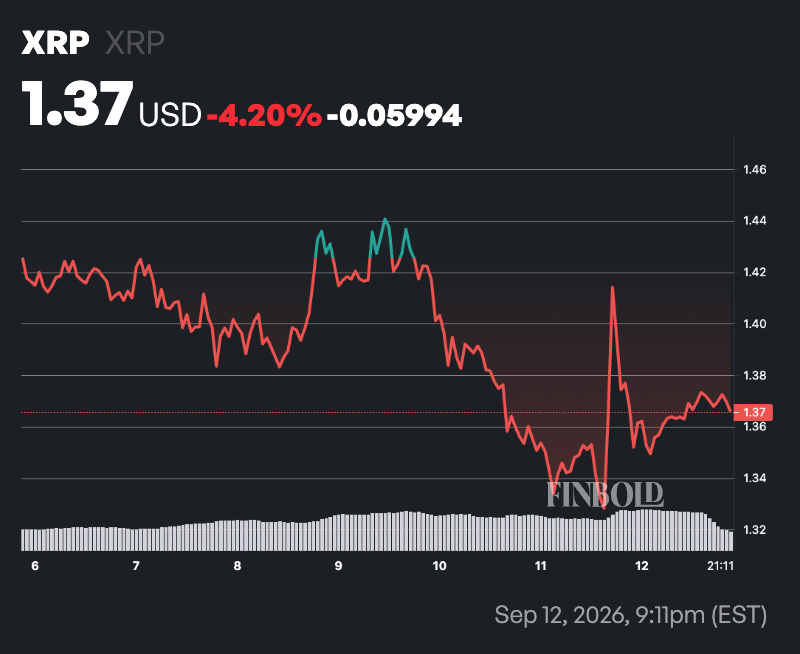 XRP seven-day price chart. Source: Finbold
Following the recent price movement, XRP remains technically bullish, trading above both its 50-day SMA of $1.21 and 200-day SMA of $1.27, suggesting the broader uptrend is still intact despite the pullback.
However, the cryptocurrency’s 14-day RSI stands at 52.87, indicating neutral momentum and balanced buying and selling pressure.
The reading is neither overbought nor oversold, leaving room for XRP to move in either direction depending on market sentiment.
Featured image via Shutterstock