 By GB News (World News) | Created at 2025-03-12 17:11:04 | Updated at 2025-03-12 21:39:01
4 hours ago
By GB News (World News) | Created at 2025-03-12 17:11:04 | Updated at 2025-03-12 21:39:01
4 hours ago
New research has revealed the UK neighbourhoods that experienced the most dramatic property price changes in a one-year period.
This could indicate where is best or worst to buy in for future price growth, based on percentage price changes from March 2023 to March 2024.
London dominates the top performers list, though several areas outside the capital have also seen substantial increases.
Norwood Green South in Ealing has emerged as the UK's property hotspot, with an astonishing 85.4 per cent price increase in just one year. The area saw median property prices jump from £410,000 to £760,000.
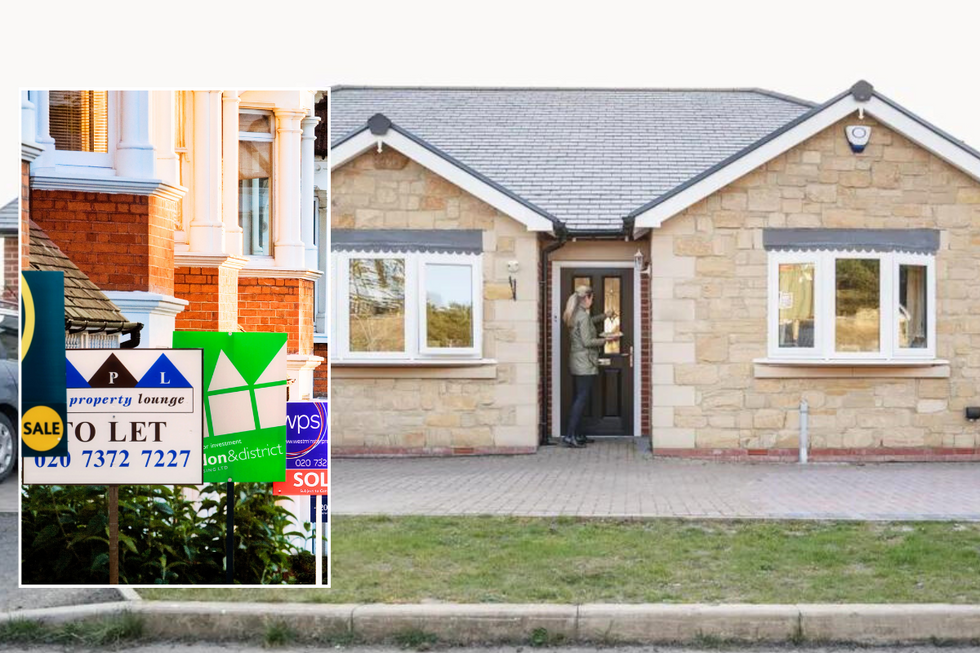
Seven areas saw property prices rise by more than seven per cent
GETTY/PA
Other London areas featuring in the top 10 include Parsons Green East & Eel Brook Common in Hammersmith and Fulham with a 64.6 per cent rise, and Highgate West in Camden at 53.5 per cent.
De Beauvoir in Hackney also performed strongly with a 51.5 per cent increase. Outside London, Camberley Town in Surrey Heath leads the growth charts with a remarkable 75.8 per cent increase, with median prices rising from £347,750 to £611,250.
Central Solihull & Sharmans Cross in Solihull follows with a 54.3 per cent increase. Hamilton North in Leicester (45.3 per cent) and Harraton, Rickleton & Fatfield in Sunderland (43.3 per cent) also feature prominently.
Towednack, Lelant & Carbis Bay in Cornwall rounds out the top five non-London areas with a 41.9 per cent increase.
At the other end of the spectrum, St John's Wood South in Westminster recorded the steepest decline, with prices plummeting by 50.2 per cent from £1,234,325 to £615,000.
While buying property in the UK's capital is often considered a good idea, the research suggested some parts of the city had a huge decline.
Top 10 areas for house price growth (percentage increase)
- Norwood Green South, Ealing: 85.4%
- Camberley Town, Surrey Heath: 75.8%
- Parsons Green East & Eel Brook Common, Hammersmith and Fulham: 64.6%
- Woodcote, Croydon: 62.2%
- Central Solihull & Sharmans Cross, Solihull: 54.3%
- Highgate West, Camden: 53.5%
- De Beauvoir, Hackney: 51.5%
- Wimbledon Park & Durnsford Road, Merton: 49.9%
- Herne Hill & Dulwich Park, Southwark: 48.6%
- Chiswick South West, Hounslow: 47.9%
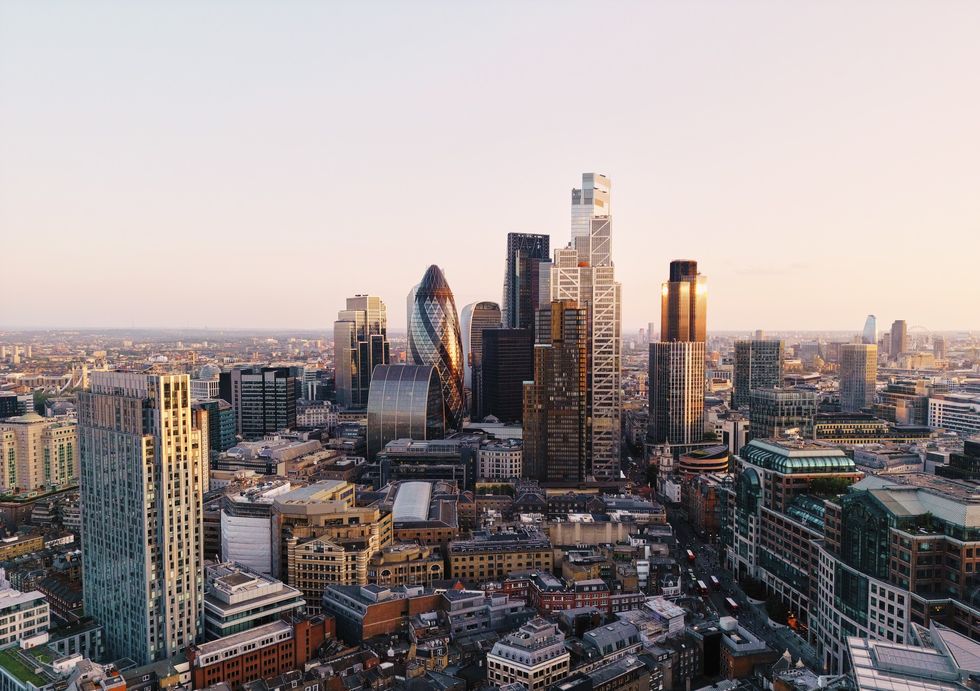
House prices in London were mixed
GETTY
Top 10 areas with biggest house price decreases (percentage decrease)
- St John's Wood South, Westminster: 50.2%
- St George in the East & Wapping North, Tower Hamlets: 49.7%
- Holland Park, Kensington and Chelsea: 44.3%
- Chopwell & High Spen, Gateshead: 41.7%
- Broughton East, Salford: 37.9%
- Lozells West, Birmingham: 36.5%
- Isles of Scilly: 36.4%
- Wellington East, Telford and Wrekin: 35.8%
- Manningham & Lister Park, Bradford: 35.3%
- Knowsley Village & Southdene, Knowsley: 34.5%