By crypto.news | Created at 2026-06-24 13:02:39 | Updated at 2026-06-24 13:52:17
1 hour ago
By crypto.news | Created at 2026-06-24 13:02:39 | Updated at 2026-06-24 13:52:17
1 hour ago
XRP price has tested a key support zone near $1.08 after a week of sustained selling pressure that followed Ripple’s regulatory breakthrough in Europe and a wider retreat across digital assets.
Summary
- XRP has fallen toward key support near $1.08 while trading inside a falling wedge pattern.
- CoinGlass data shows a major liquidation cluster around $1.14 that could attract price if buyers step in.
- A break below $1.08 may expose XRP to further losses toward the $1.05 and $1.00 levels.
According to data from crypto.news, XRP (XRP) was trading around $1.09 on June 24, down more than 15% from its June 16 peak near $1.29. The decline came shortly after Ripple secured preliminary approval under Europe’s Markets in Crypto-Assets framework through Luxembourg, a development that grants passporting rights across the European Economic Area.
More licensing momentum!
Ripple has secured its preliminary Crypto Asset Service Provider (CASP) license in Luxembourg, paving the way for the full rollout of Ripple Payments across the EEA and full MiCA compliance: https://t.co/APQcYnCy9c
The next wave of regulated digital…
Rather than extending the rally, traders used the announcement as an opportunity to lock in profits as Bitcoin slipped below key support levels and risk appetite weakened across crypto markets.
The pullback coincided with renewed pressure on Bitcoin, which briefly fell below $62,000 during the latest market correction. Oil prices also remained volatile after recent geopolitical tensions in the Middle East, while investors continued to assess the Federal Reserve’s outlook for interest rates. Elevated borrowing costs have limited speculative flows into digital assets throughout the second quarter.
Market sentiment has also struggled to recover after several weeks of capital rotation toward artificial intelligence and semiconductor stocks. While tokenization and stablecoin adoption continue to attract institutional interest, much of that activity has yet to translate into fresh demand for large-cap altcoins such as XRP.
Falling wedge pattern keeps recovery scenario alive
The four-hour chart shows XRP trading within a falling wedge formation that has developed since the June 16 high near $1.28. The pattern consists of converging downward-sloping trendlines and often precedes bullish reversals when selling momentum begins to weaken.
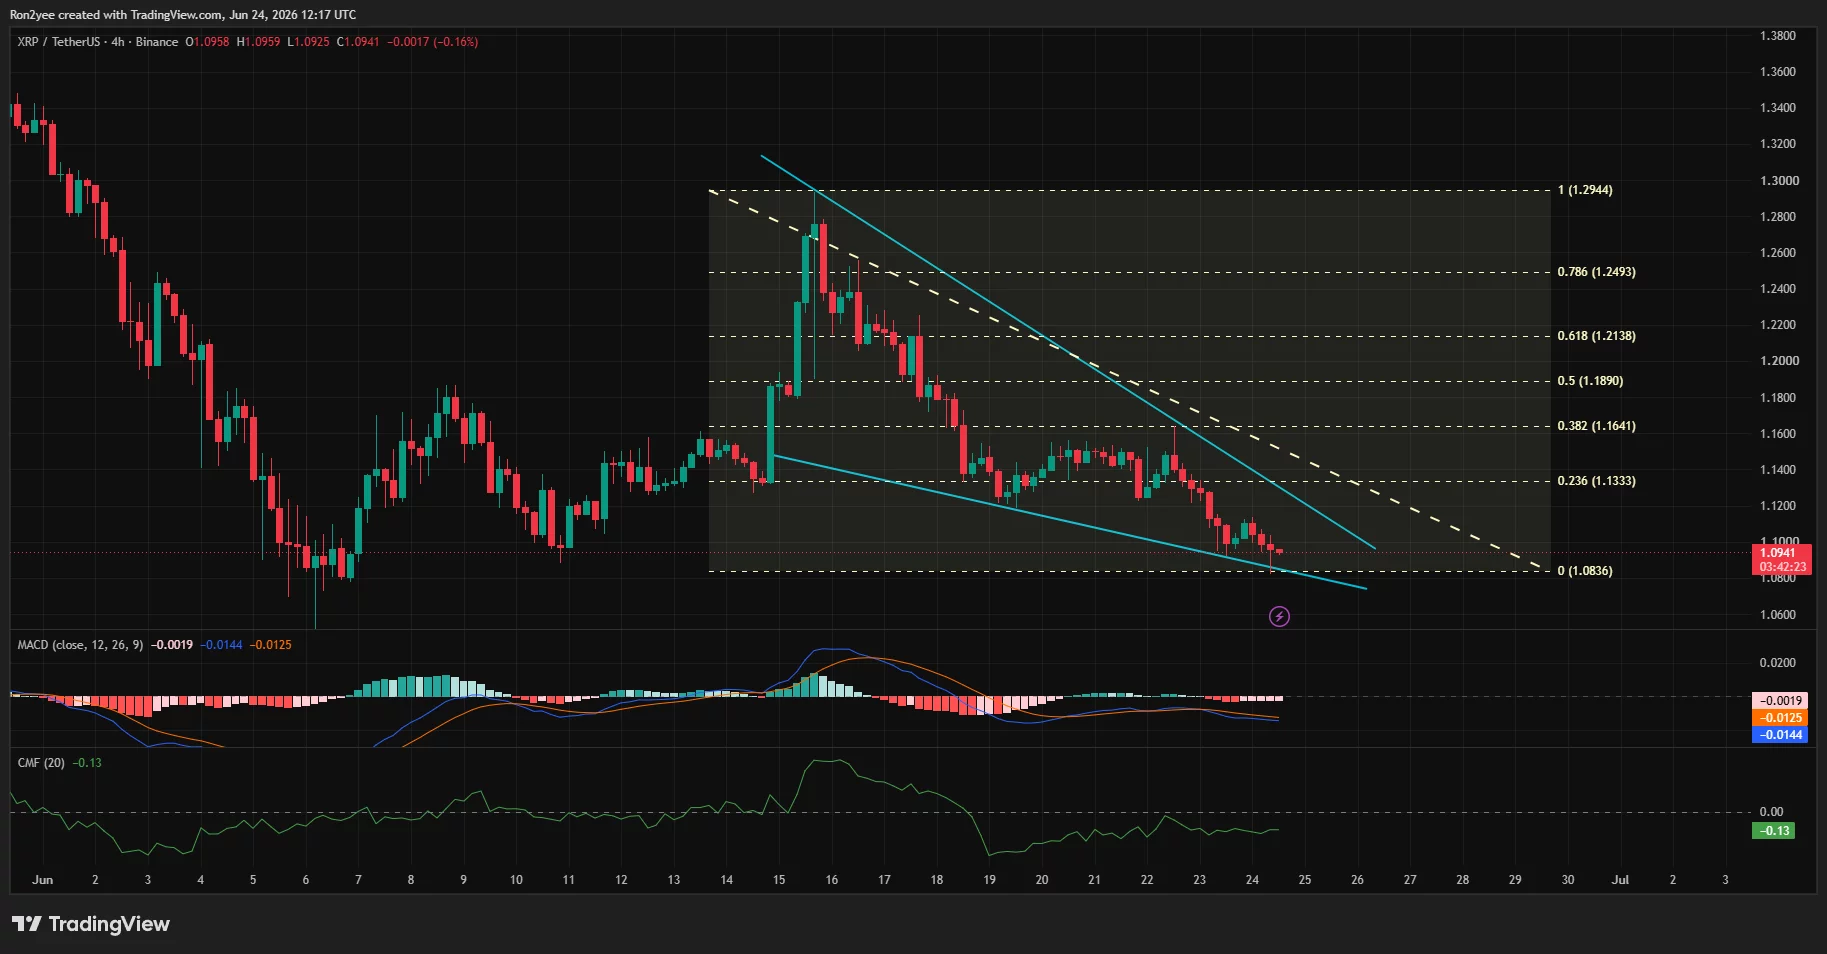 XRP price has formed a falling wedge pattern on the 4-hour chart — June 24 | Source: crypto.news
Price action has already reached the lower boundary of the wedge near the $1.08 area, a level that also aligns with a key Fibonacci support zone. A breakout above the upper trendline could expose resistance levels at $1.13, $1.16, and $1.19. The 50% Fibonacci retracement level sits near $1.189, while the 61.8% retracement level is located around $1.214.
Momentum indicators remain mixed. The four-hour MACD remains below the zero line, showing sellers still control short-term momentum. At the same time, the histogram has begun to flatten, suggesting downside momentum is losing strength. Chaikin Money Flow remains negative at approximately -0.13, showing capital continues to leave the market.
The daily chart presents a more challenging picture for bulls. XRP remains below its daily Supertrend resistance near $1.24 and continues to trade under a sequence of lower highs that has been in place since mid-May. Daily RSI sits near 36, leaving room for further downside before the asset reaches deeply oversold territory.
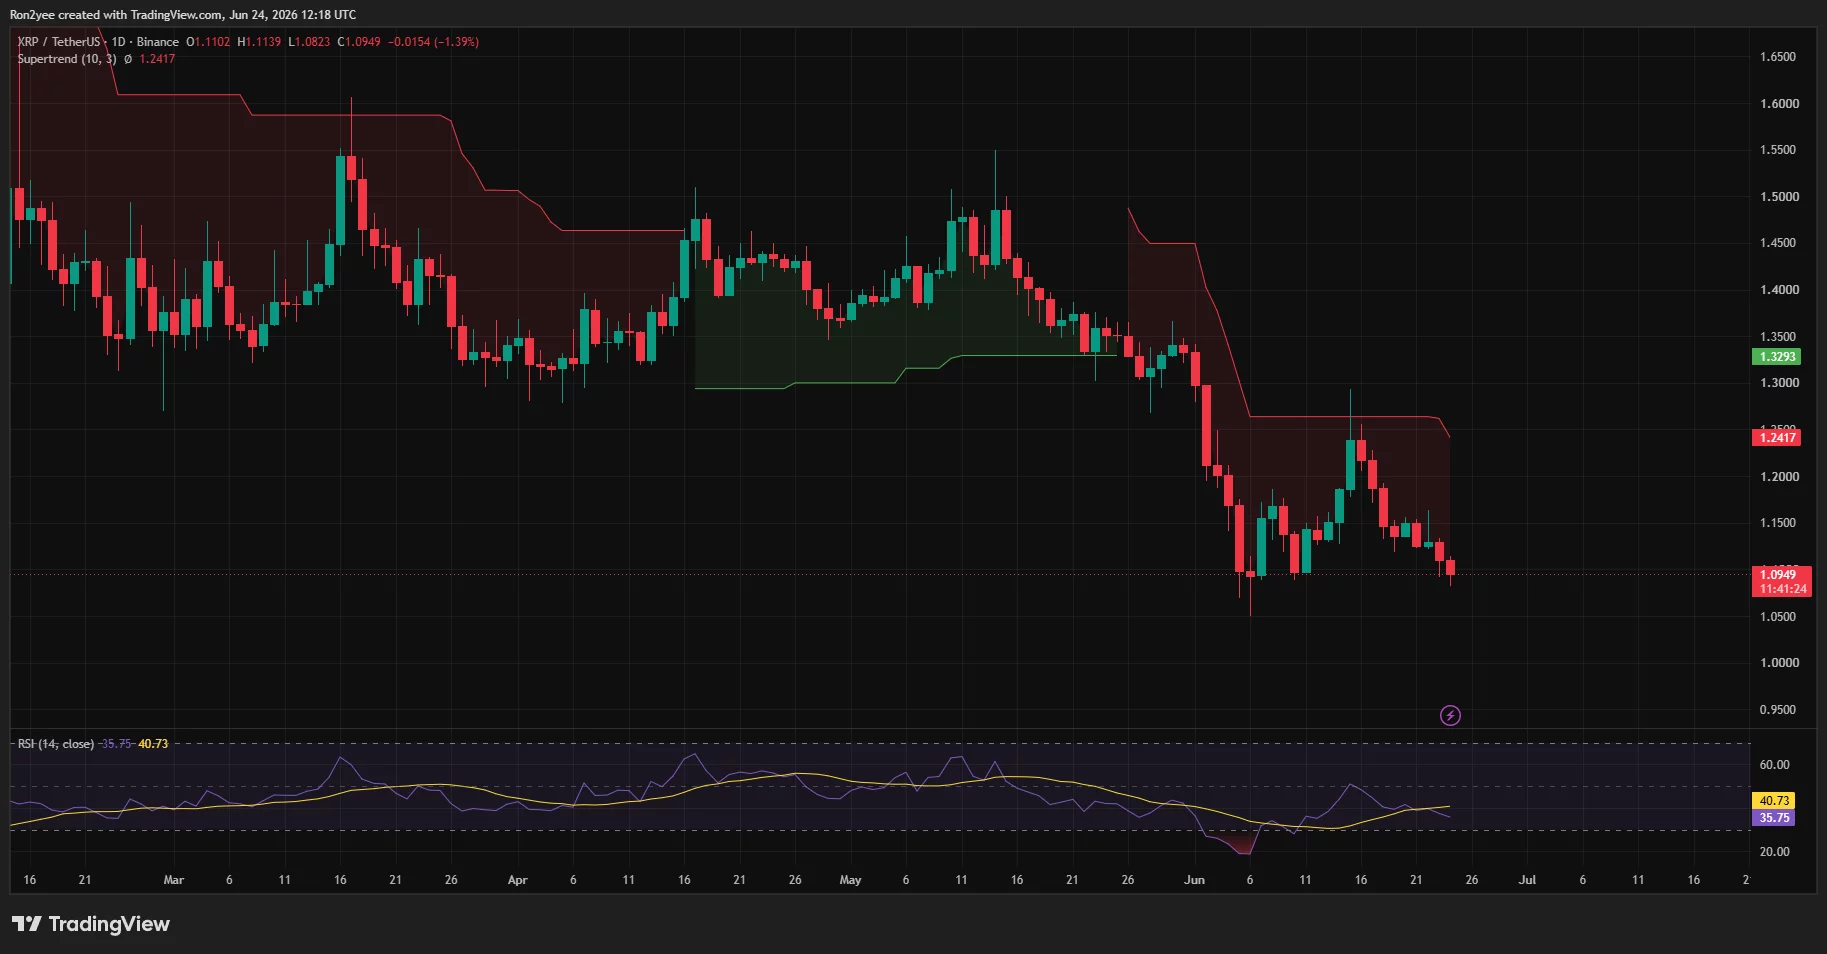 XRP daily price chart — June 24 | Source: crypto.news
Liquidation clusters place $1.14 in focus for XRP bulls
CoinGlass liquidation data shows one of the largest concentrations of leveraged positions sitting between $1.13 and $1.15, with the strongest liquidity cluster located near $1.14. Those levels have emerged as a potential short-term magnet should buyers trigger a recovery from current support.
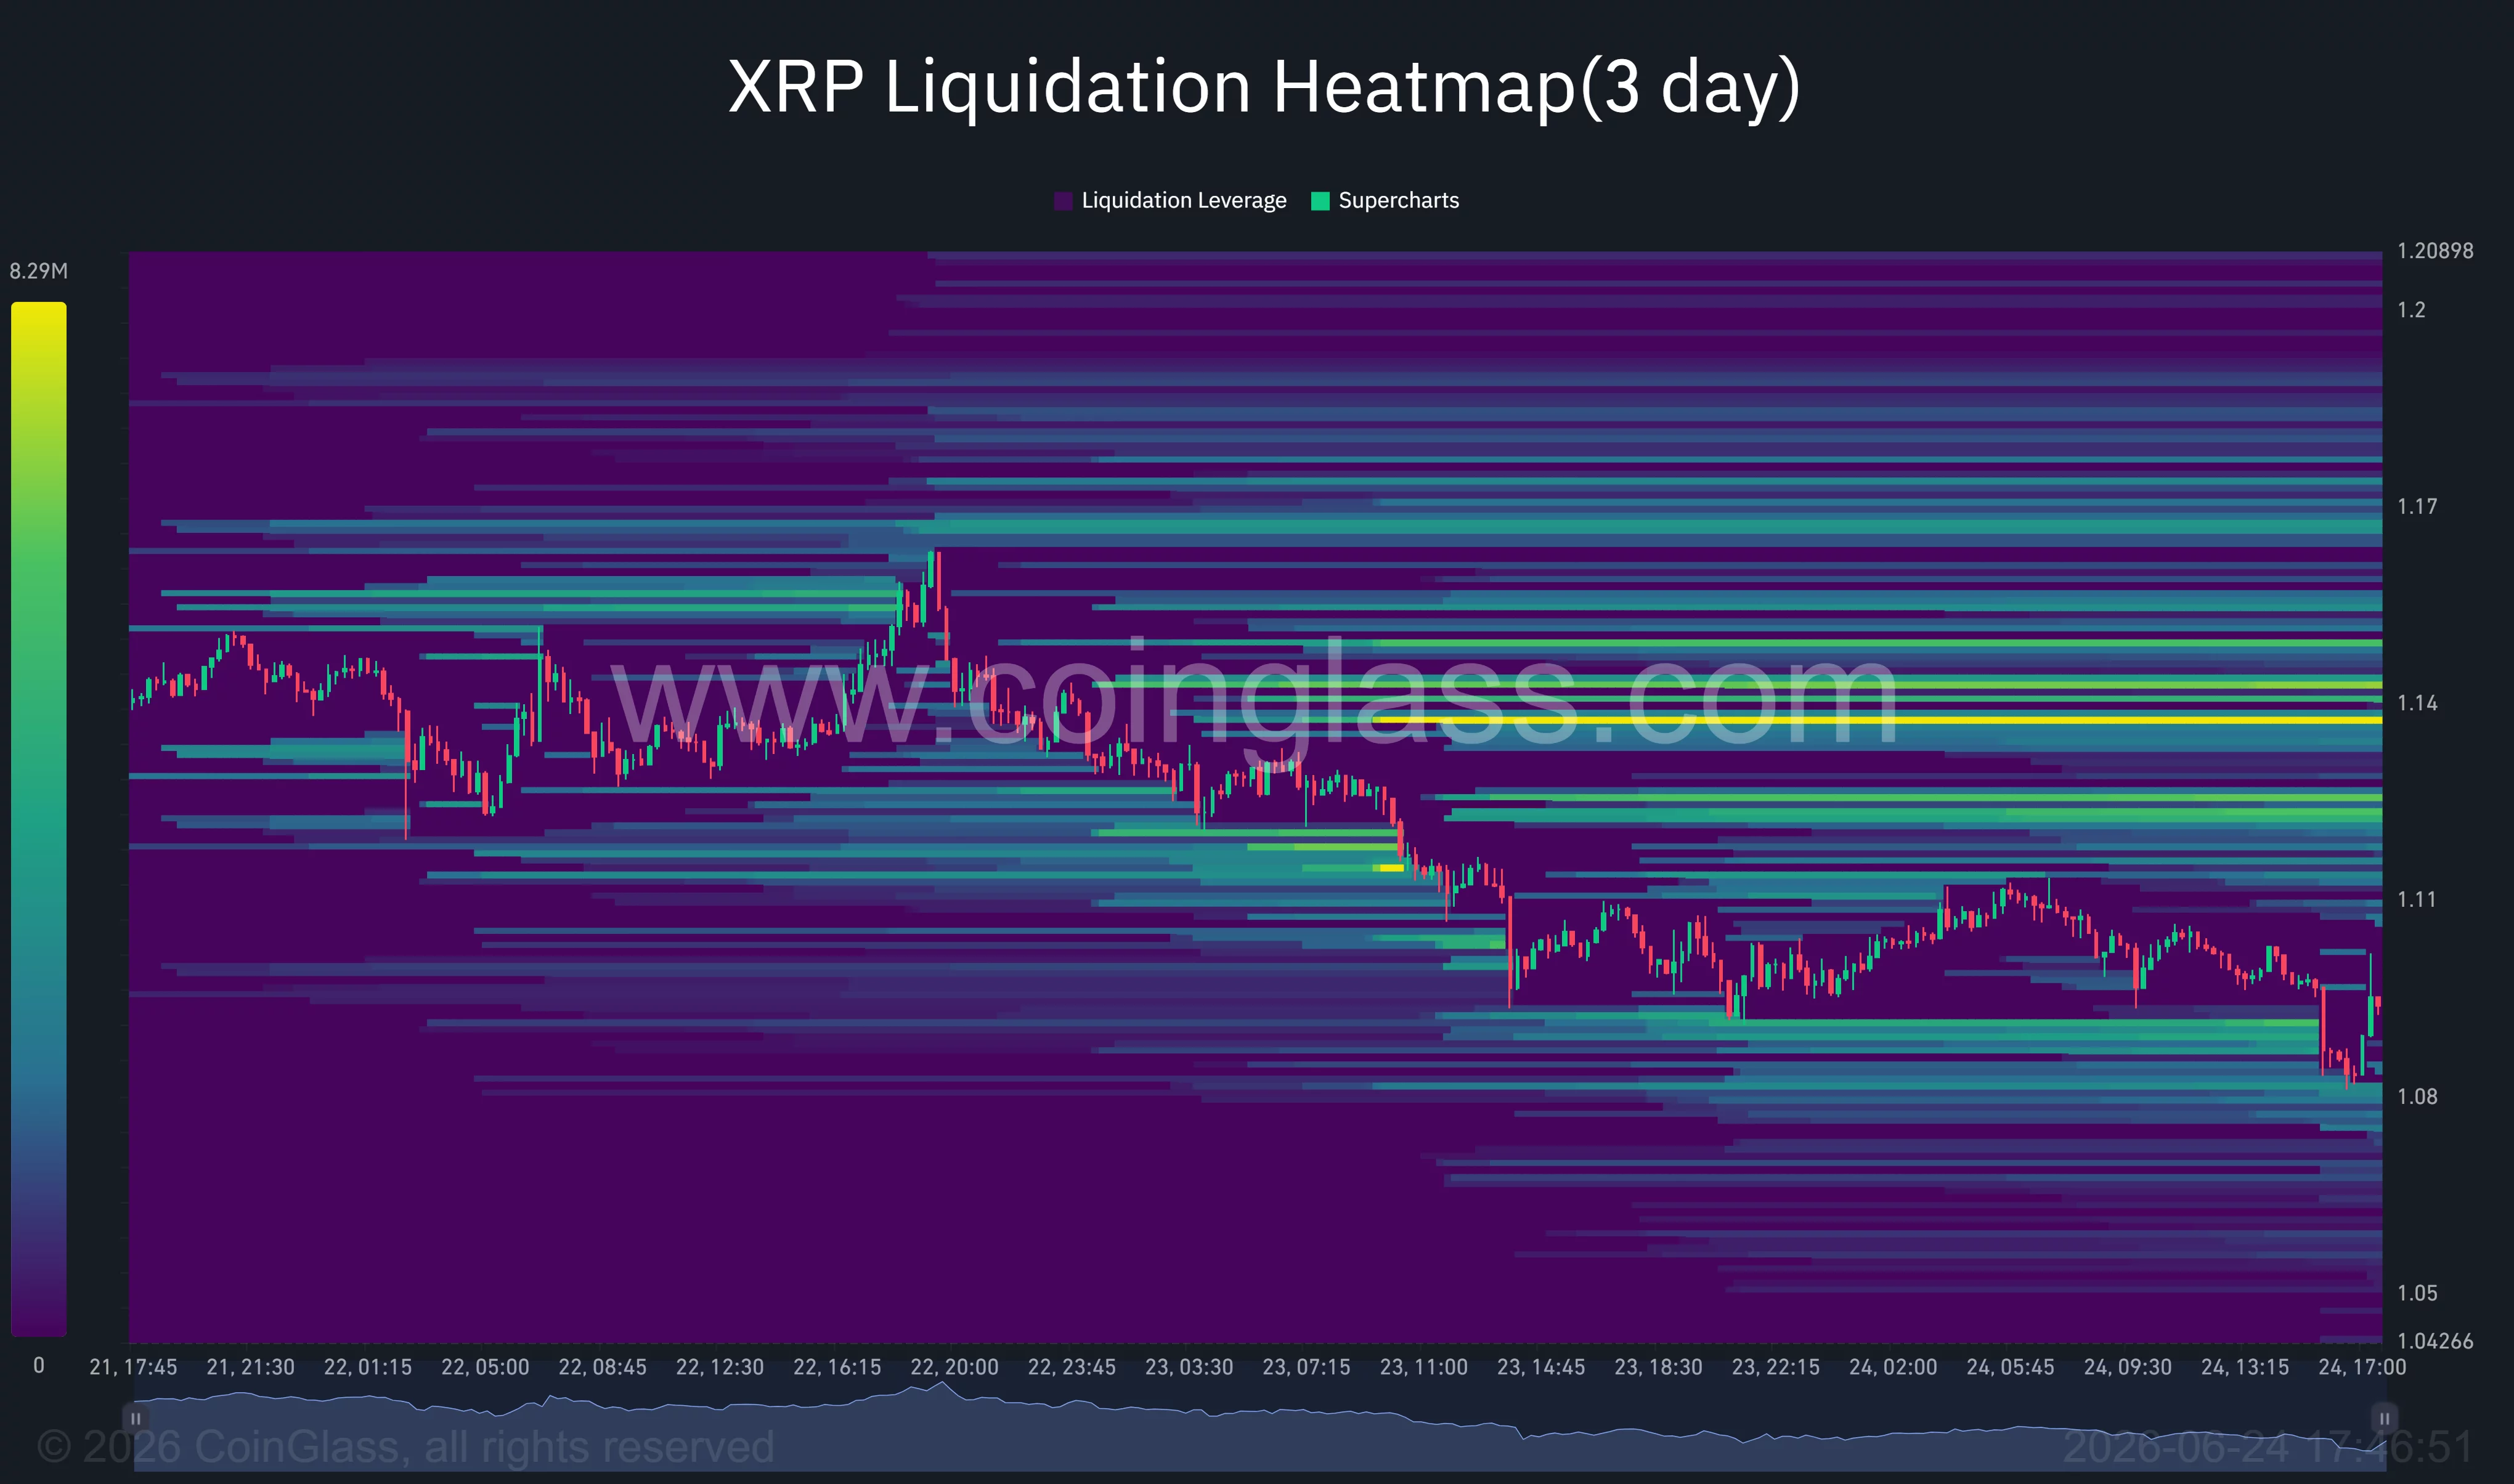 XRP liquidation heatmap | Source: CoinGlass
The heatmap also shows fewer large liquidation pools below current prices, suggesting a significant portion of downside leverage has already been flushed out during the recent decline from $1.16 to $1.08. A move into the $1.14 region could force short liquidations and accelerate a relief rally.
Failure to hold the lower wedge boundary would invalidate the bullish setup. A decisive break below $1.08 could expose psychological support at $1.05 and increase the risk of a deeper move toward the $1.00 level. Continued weakness in Bitcoin, another hawkish shift from the Federal Reserve, or a resurgence in geopolitical tensions could add further pressure to XRP and delay any recovery attempt.
Disclosure: This article does not represent investment advice. The content and materials featured on this page are for educational purposes only.